I just got an S8 POE today as I had seen some weirdness with my Aruba Switch when powering my AP6-Pros ( I had one AP that wouldn’t power on and I thought was dead until I moved it to an old TP-Link POE switch).
Anyway I noticed that the switch constantly has almost 100% CPU usage with 3 APS and a TP-Link 16 port plugged into it before it goes to my OpenWRT router which is run on a Raspberry Pi 5.
Hmm, to my knowledge that’s not normal or expected. You will see it spike during firmware upgrades, or while provisioning but it should not be consistently at ~100%.
I understand the 3x AP6-Pro and TP-Link switch connect to the S8. Does the S8 connect to the router? Or just the TP-Link switch? Or both?
Has the system load been pegged since initial set up? Or did you happen to notice if it started after a certain event?
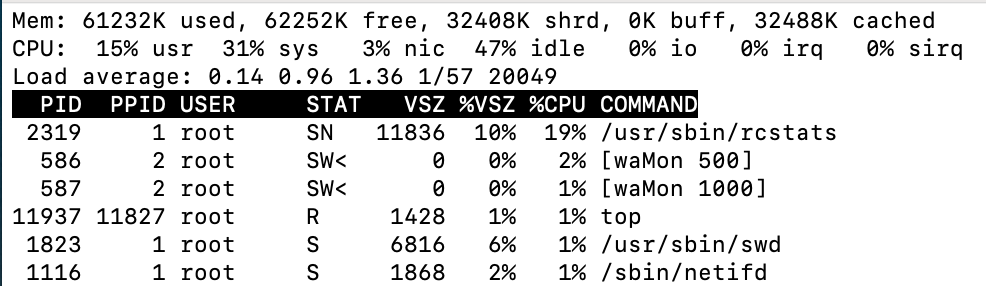
Are you familiar with SSH? If so, have you provisioned an SSH key? If not, there is another way too. I’d like to review a screenshot of top to view the process(es) consuming the device’s resources.
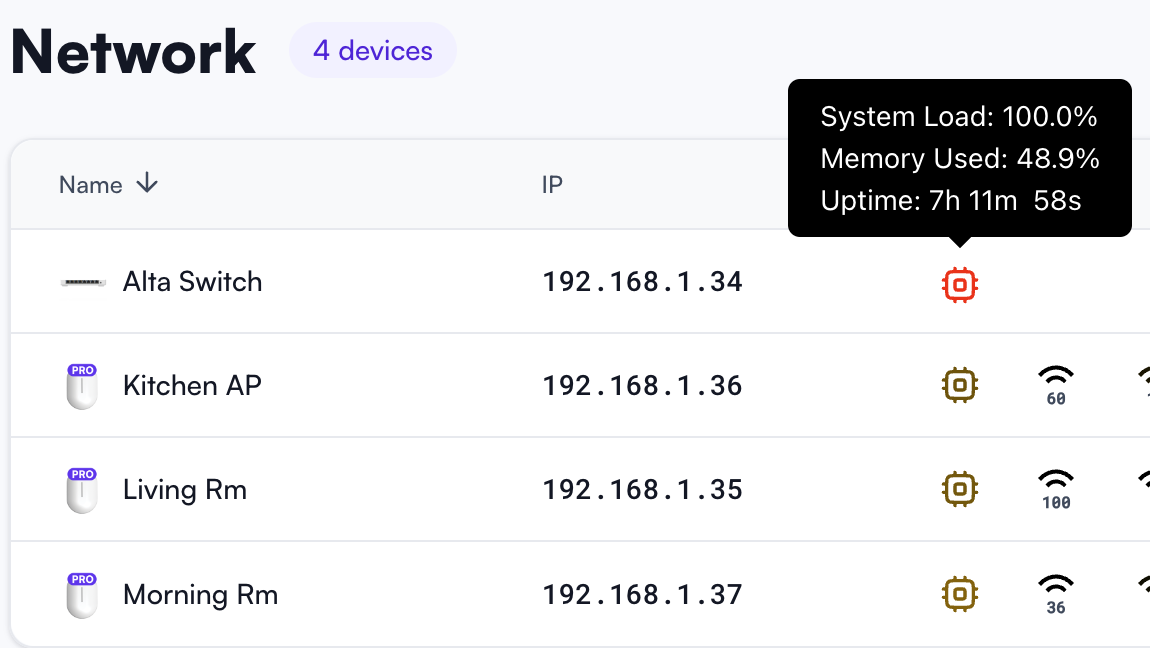
I have rebooted a few times but it still seems to hang around the 100% mark with occasional dips to 60/ 70% but most times the little icon for the CPU is either Red or Orange.
The S8 is connected to the router and the TP-Link is connected to the S8 - the reason for this is the router only has one lan port as I am using a Raspberry Pi 5 running OpenWRT.
I only got the S8 yesterday and it has been pegged since then despite updating the switch to the latest firmware and 1.2J
I don’t know how to provision a SSH key sadly - used SSH before but never provisioned a key. It would be great to see the top processes consuming the devices resources, let me know how to go about it please.
Before I forget about this. Is this the only weirdness you noticed? Or was there anything else? Can you please share the model of Aruba switch?
Thanks for confirming the topology. That’s totally fine, I was more so checking for a loop. If a loop was present but it didn’t crash the switch, then typically the CPU would be processing more traffic (and reporting a higher load). Same with something like a broadcast storm.
Given this topology, it may be worth disconnecting the TP-Link switch for 1-5 minutes, or less, depending on if the load changes by segmenting the network a bit (and if that’s even an option). I’m not saying it’s the switch causing the issue, but it would temporarily disconnect any devices behind it and theoretically lessen network traffic. If it did make a difference it would also give us a clearer direction to look (i.e. some type of traffic on the wired side). If it turns out to be some bug, we’ll want to get it fixed, and that would be a pretty quick way to potentially narrow down the scope.
No worries! So, sorry, I was getting a bit ahead of myself. There isn’t another way for switches, yet. For now you’ll have to add an SSH key. We do have a guide on that, found HERE. Basically you need to create an SSH key, then copy the public key and paste it into management.
I’m happy to expand on those instructions if you have any questions. Once the SSH key is added to management, you can connect via SSH from your preferred shell/terminal software and issue top. I can write steps on that if it would be helpful, I would just need to know what I’m working with.
The switch is an Aruba instant on 1830 POE 24 port - JL813A
The power issue is the only issue I had with the Alta APs, the other issues I think were related to a mix of this 1830 and some of the smaller 1930 8Gs but i seem to have resolved this now. I haven’t tried powering on the Alta APs with the Aruba Switch since getting the S8.
I have swapped out the TP-Link devices and put back the 24 Port Aruba POE switch and I am still seeing the S8 hit 100% every 3-4 seconds. I am wondering if this is due to my 3 CCTV cameras, I will try disconnecting these and see what happens.
I have created keys but not sure if i did it right as at the end of the keys it has my machine name for my desktop? When i try to access the switch after entering in the SSH key to the Alta Management webpage and i still get the public key warning…does it take some time for it to populate?
I am using a Mac to create these keys and followed the instructions all apart from the last bit that didn’t work so i went to the folder they were created in and copied the key after opening it with text edit.
Oops, sorry, I wrote a reply yesterday, but I never actually clicked reply.
Thanks for sharing.
Ah, okay. I wasn’t blaming the switch itself, I was literally just looking to disconnect that part of the network and see if the load went down while it was disconnected. Did you happen to notice if the load average went down while the switch was disconnected? The reason I said the switch is it would take the other devices connected to it offline at once, without having to manually disconnect each. If the load did go down while it was disconnected then that would narrow where we focus.
If some type of traffic over the wire is causing this then I’d like to figure out what is causing it and why, and more importantly if there is something we have to fix, or maybe some configuration change. Happy to help get to the bottom of this, whatever the reason. The top output is what I’d like to check as next step, before worrying about re-testing. What happened after disconnecting the cameras? Any change?
Yes, depending on what you use to generate a key, and variables set, the hostname may be present. I can’t say I’ve timed it, but I think it’s pretty quick for it to process. Will continue below…
I actually just switched to using 1password for SSH keys on my Mac a few weeks ago. Did you perform the steps HERE? Is it prompting you to unlock/use the key when trying to connect? Or can you tell if it’s trying the saved key via 1password?
I got it working - finally in, got to say 1Password is a great way to make and manage SSH keys and could be a great route for those not as technical.
Now as i said I had put the Aruba Switch back but what i forgot to say was that the S8 now connects to the Aruba and the Aruba is out to the router - this seems to have helped with the load on the S8 switch and i am now only seeeing it hit the red occasionally.
Now that I have SSH access i looked at - top - and it doesn’t argee with the stats i see online. Is - top - the best command to use? i tried htop but it didn’t work.
Hmm, it should show similar. Yeah, htop is not bundled. Generally when I’m checking if I’m adding usr, sys, and nic CPU I get the reported matches system load in the UI.
Is it still spiking between red or orange? Was management open when you checked top in this screenshot? Can you check with management closed and see if you’re still seeing ~50%+ use? Or is it still behaving better since you switched the topology around? Have you had any unexpected reboots or slowdowns that you suspect are caused by load?
I am still seeing spikes up to around 100% every 15 - 20 seconds or so despite only have 1 AP and a single desktop using the switch. It’s better than it was and it has been up for around 11 days with no issues but it is worrying to see it still hitting that level. Rest of the time it is hovering around 30%.