I know this is a rather old post, but I figured I would chime in as I am seeing similar spikes and mid-to-high utilizations just in general. It isn’t as often as the users above, but it still happens.
Typical CPU: 30% - 38%
CPU Spikes: 60% - 80%
Typical Memory: 45% - 48%
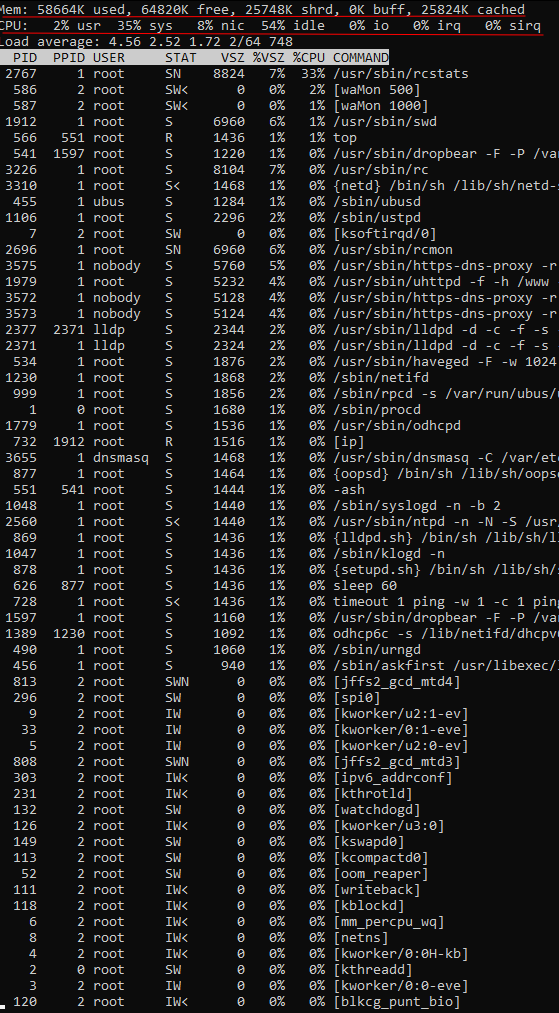
That being said rcstats by itself seems to be using the MOST resources, both Memory and System wise.
Mind you, I have powercycled the 8-Port Switch as well as made sure everything was up-to-date. There are 3 devices plugged into it, as well as the uplink to the router.
Magic Jack
SFF HP Elitedesk PC (Running MeshSense & Foundry VTT)
Eero 6+
Router Uplink
Seems like the rcstats task needs to be re-worked / optimized some more, and to keep the cloud-portal from pinging the hell out of it as well. Not a fan of using an 8 port switch and only having 26 devices hardly being utilized and it showing Yellow / Orange / Red at times.
That being said, my Route10 isn’t hardly batting an eye as far as system usage goes. Memory usage is a little rough at 40%, but I will live with it.
When the cpu utilization spikes between 80% - 85%, it does cause issues with connectivity / latency. But after it subsides, it returns back to normal and devices are stable. This typically happens every 30 - 40 seconds, and always seems to be the RCSTATS task that matches the spikes.
The web and app dashboards typically show the similar spikes as the CLI / SSH session. The above screenshot still shows similar stats / tasks, and I have not made any additional changes to my network at this point outside of updated firmware.
Between the Alta Labs forum as well as the Alta Labs subreddit, I have seen a few posts about similar situations but it doesn’t seem to be a wide-spread issue. I initially posted on another forum thread and since was closed / split into a new topic on the 24th of January. The prior post didn’t yield any additional detail(s) / fixes / suggestions / changes, etc.
@user19 What exact connectivity issues are you having? Can you please be very specific? We are not able to reproduce any connectivity issues described in this thread, so your cooperation in understanding what is going on at your specific site would be greatly appreciated.
I have at this point swapped back to Ubiquiti gear, and returned the Route10 / 8P-POE switch from the vendor I had ordered from. I really don’t want to keep having to ping back and forth, just to not get anywhere on troubleshooting with staff / issues. Maybe in the future I will revisit Alta Labs and their EQ. But for the time being, I don’t have the time / ability to spend on this. I have several family related emergencies that just sapped my time up.
Sorry for wasting any sort of time / caused any inconveniences.
Sorry to hear about your family emergencies. We’ll be ready to help understand what’s going on there when you decide to try us out again. We’re not seeing anything that could cause connectivity issues in our test labs / sites, but we’re happy to dig in there at some point.
Do you have any clarifications to add? As noted before, we are experiencing great difficulty in reproducing the described connectivity and latency issues.
If this question was directed towards me, please see initial post and this reply.
Unfortunately, I no longer have the Route10 or 8-Port Switch, as I have returned them to the vendor I purchased it from. I did notate the issue(s) I was having with it, when I returned / RMA’d it. I unfortunately didn’t have the additional time to spend on troubleshooting due to family medical issue(s).
My initial post covered what information I had, which was:
Screenshot of my SSH session into my 8-Port POE Switch.
Symptoms were random spikes in CPU usage.
Seen these spikes on both Web GUI & SSH (CLI) session.
Specific Task spiking was “rcstats”. Didn’t notice other tasks spiking or utilizing any sort of high resource usage / spikes.
Every 25 - 30 seconds, CPU would spike to 80%+
Seeing performance impact (Answered later in forum) - Yes
What performance impact being seeing? Packet Loss / Port Drops
Did I perform reboots / updates? Yes
Here is the info I forgot to include, that I do apologize on:
Did I unplug all devices outside of my machine to test each port? Yes
Was the switch connected to the Route10 during test(s)? Yes
Did I ping any DNS servers? Yes
Did I see packet loss during pings? Yes
Did I ping my gateway during test(s)? Yes
Did I notice packet loss while pinging gateway? Yes
Did I swap out physical cabling? Yes
Did I move power to another outlet to be safe? Yes
Did I have any vLANs / Firewall Rules set during test(s)? No, removed all.
Did I remove switch from management interface / app and reset it during testing? Yes
Did removing it / adding it resolve issue? No
Did I test from Route10 after testing switch? Yes
Did I see same issue on Route10? No
To me, it seemed almost like a hardware / software tick issue with that specific device. @user19 may have additional information to provide though as it seemed almost exactly like my issue. But I believe his was hitting 100% utilization.
Thank you again. I had replied to the comment by @user19 but we are also very interested in reproducing your issue, @BeardedTaz. If you find yourself in possession of our equipment again, please ping me directly at your earliest convenience.
Sorry for the slow response but work is manic at the moment. I will try to get the S8 connected again next week and then get in touch, sorry I can’t help at the moment.
One thing I do notice is that items show on the web ui as connected to the S8 switch which are connected to my
Main Aruba switch but I think this is due to the way it discovers wired items but it’s confusing as some items show twice?
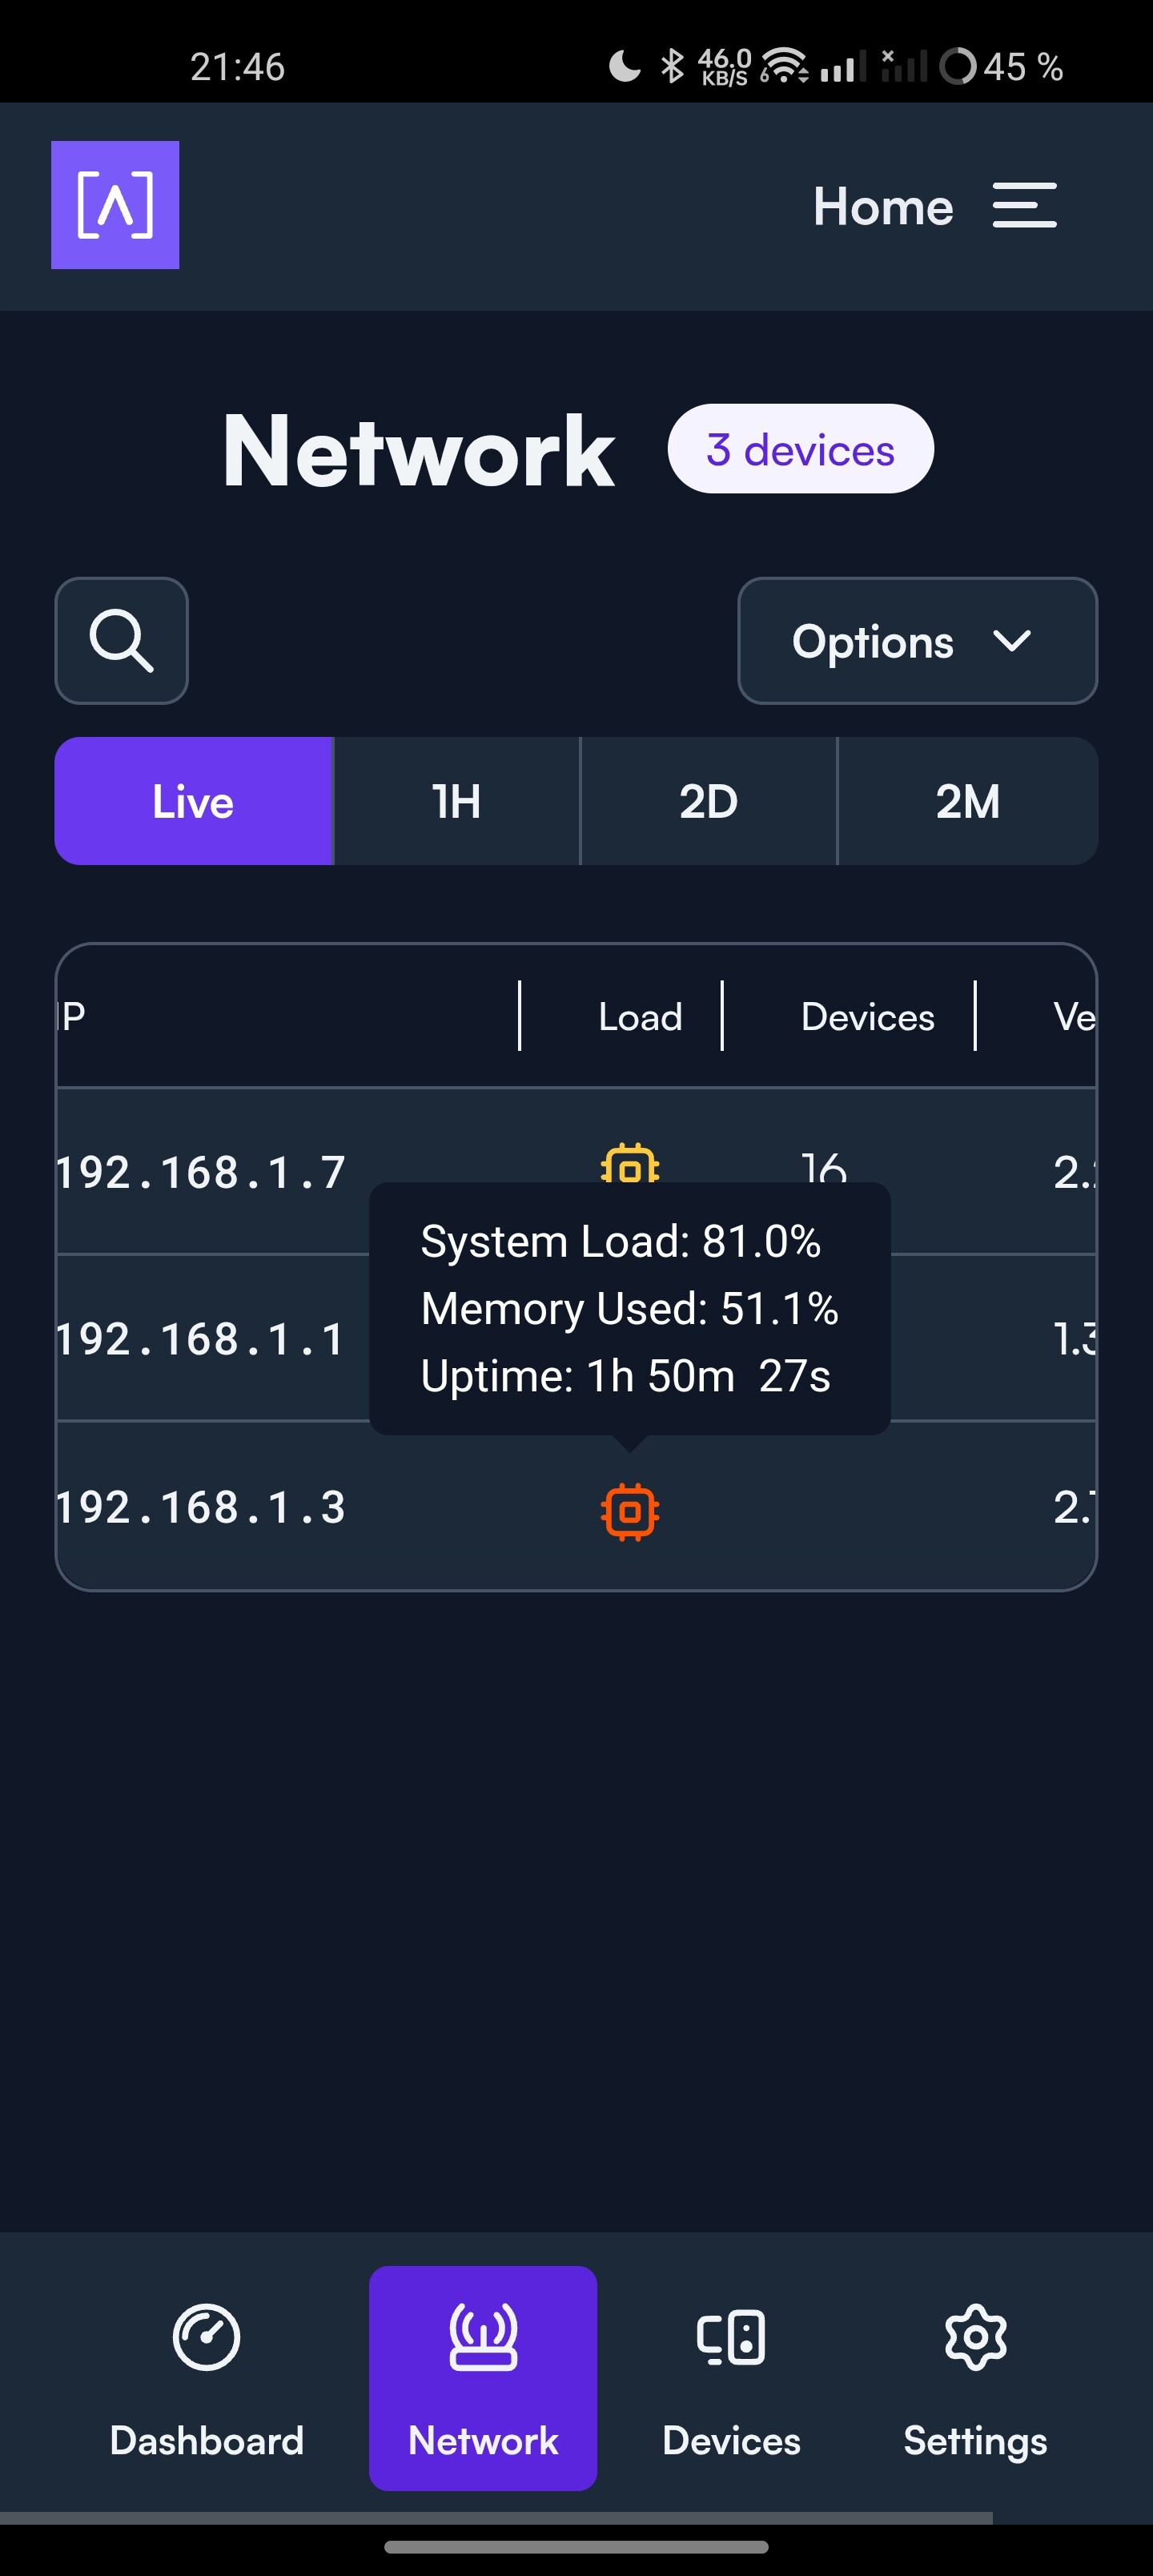
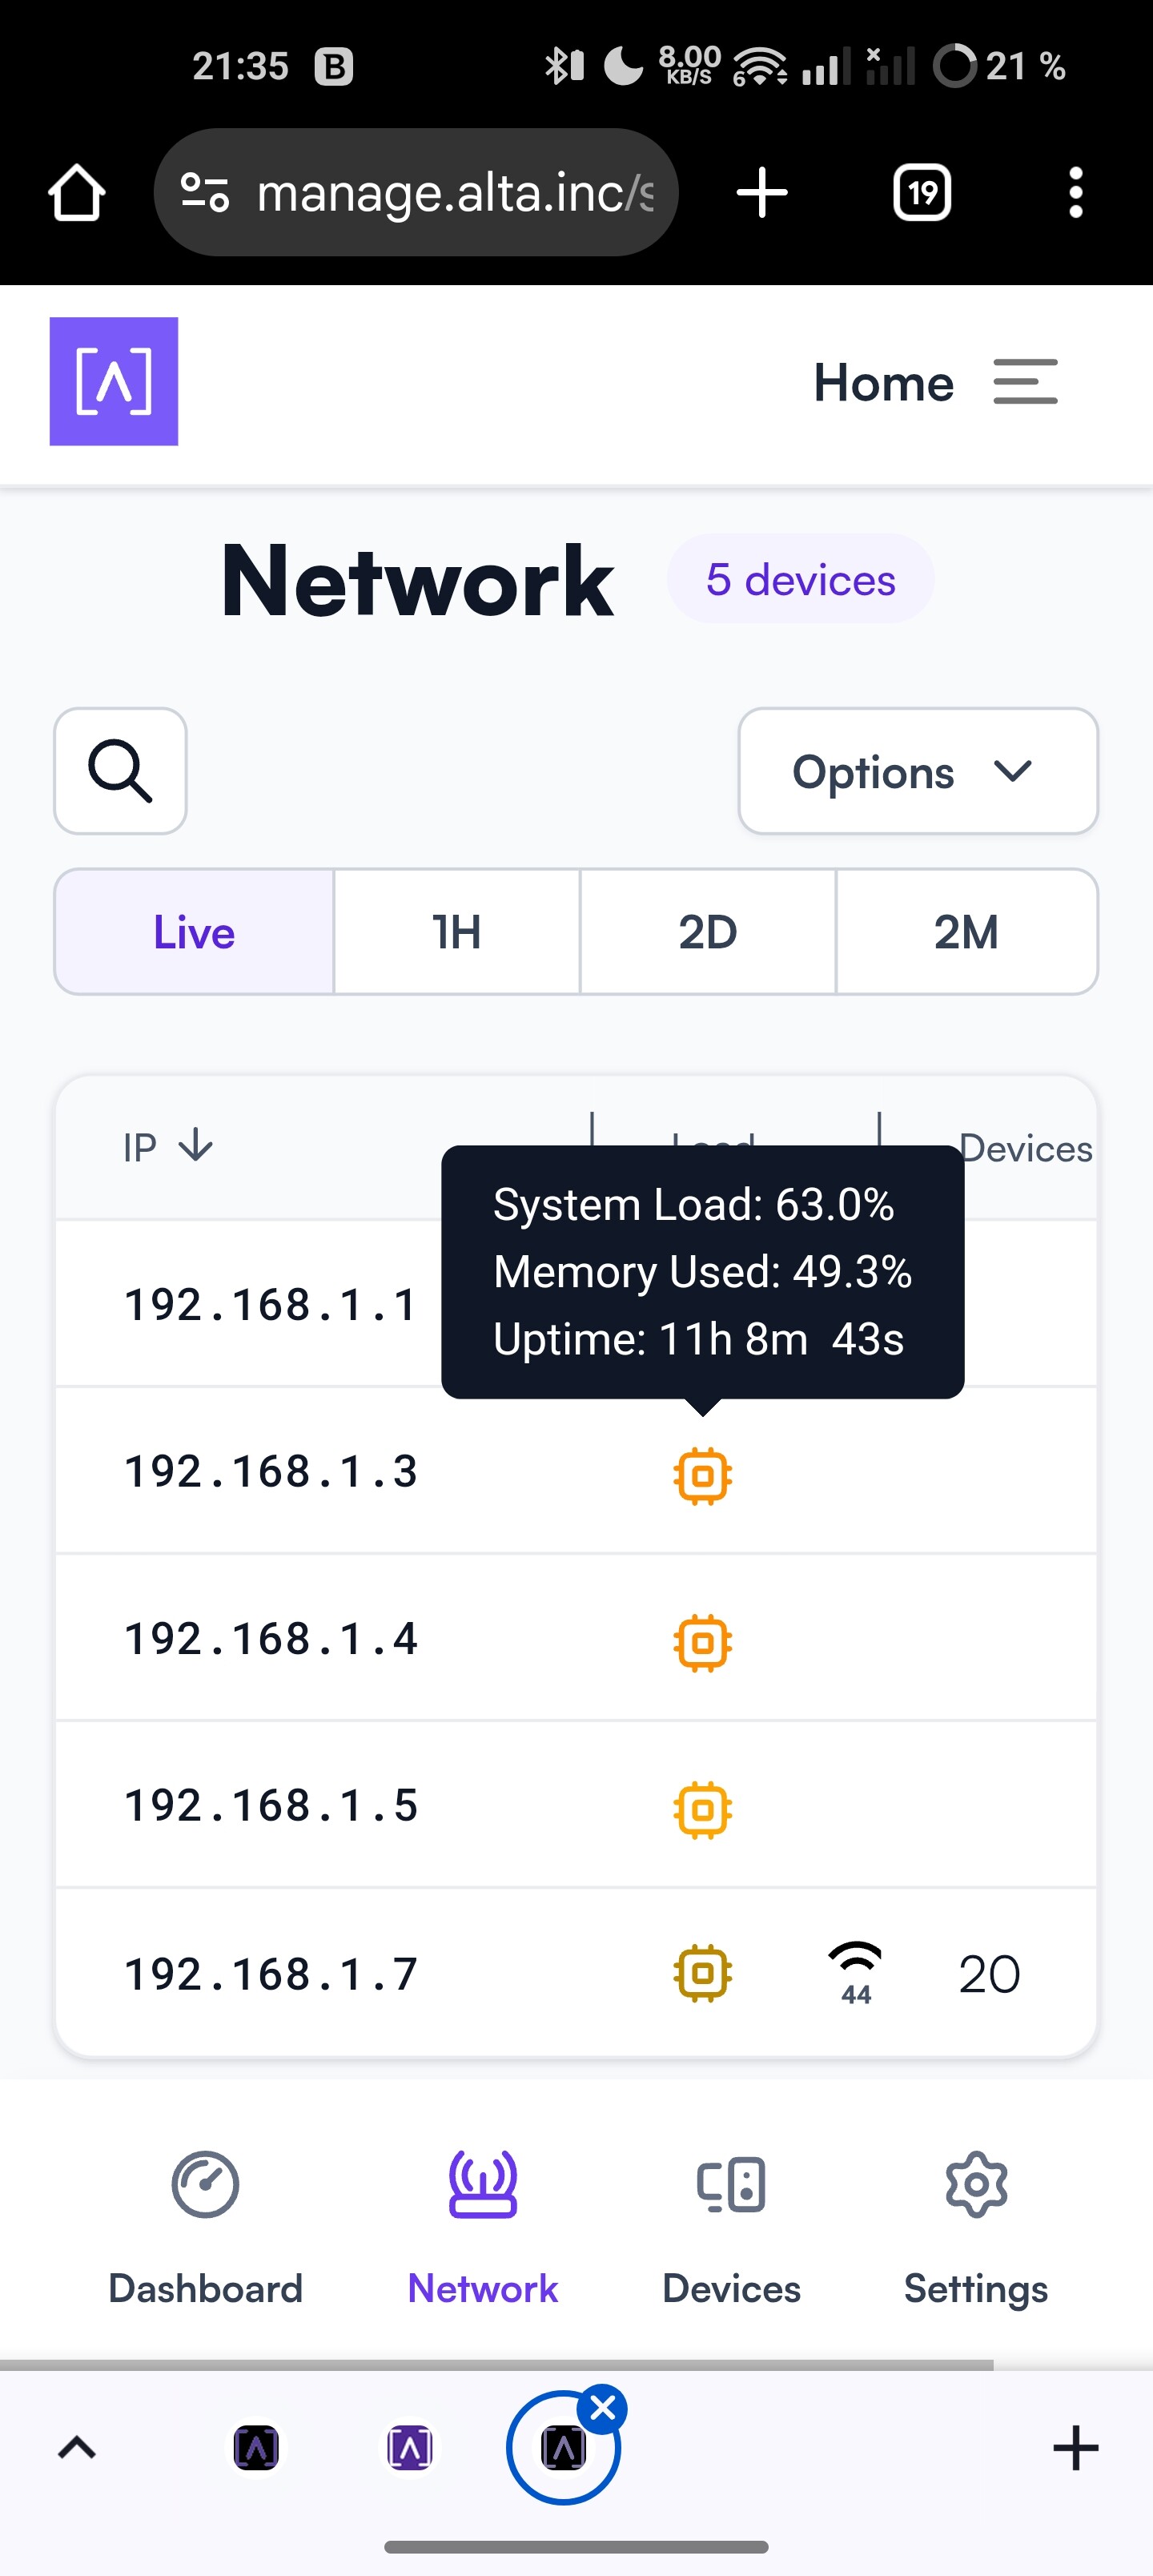
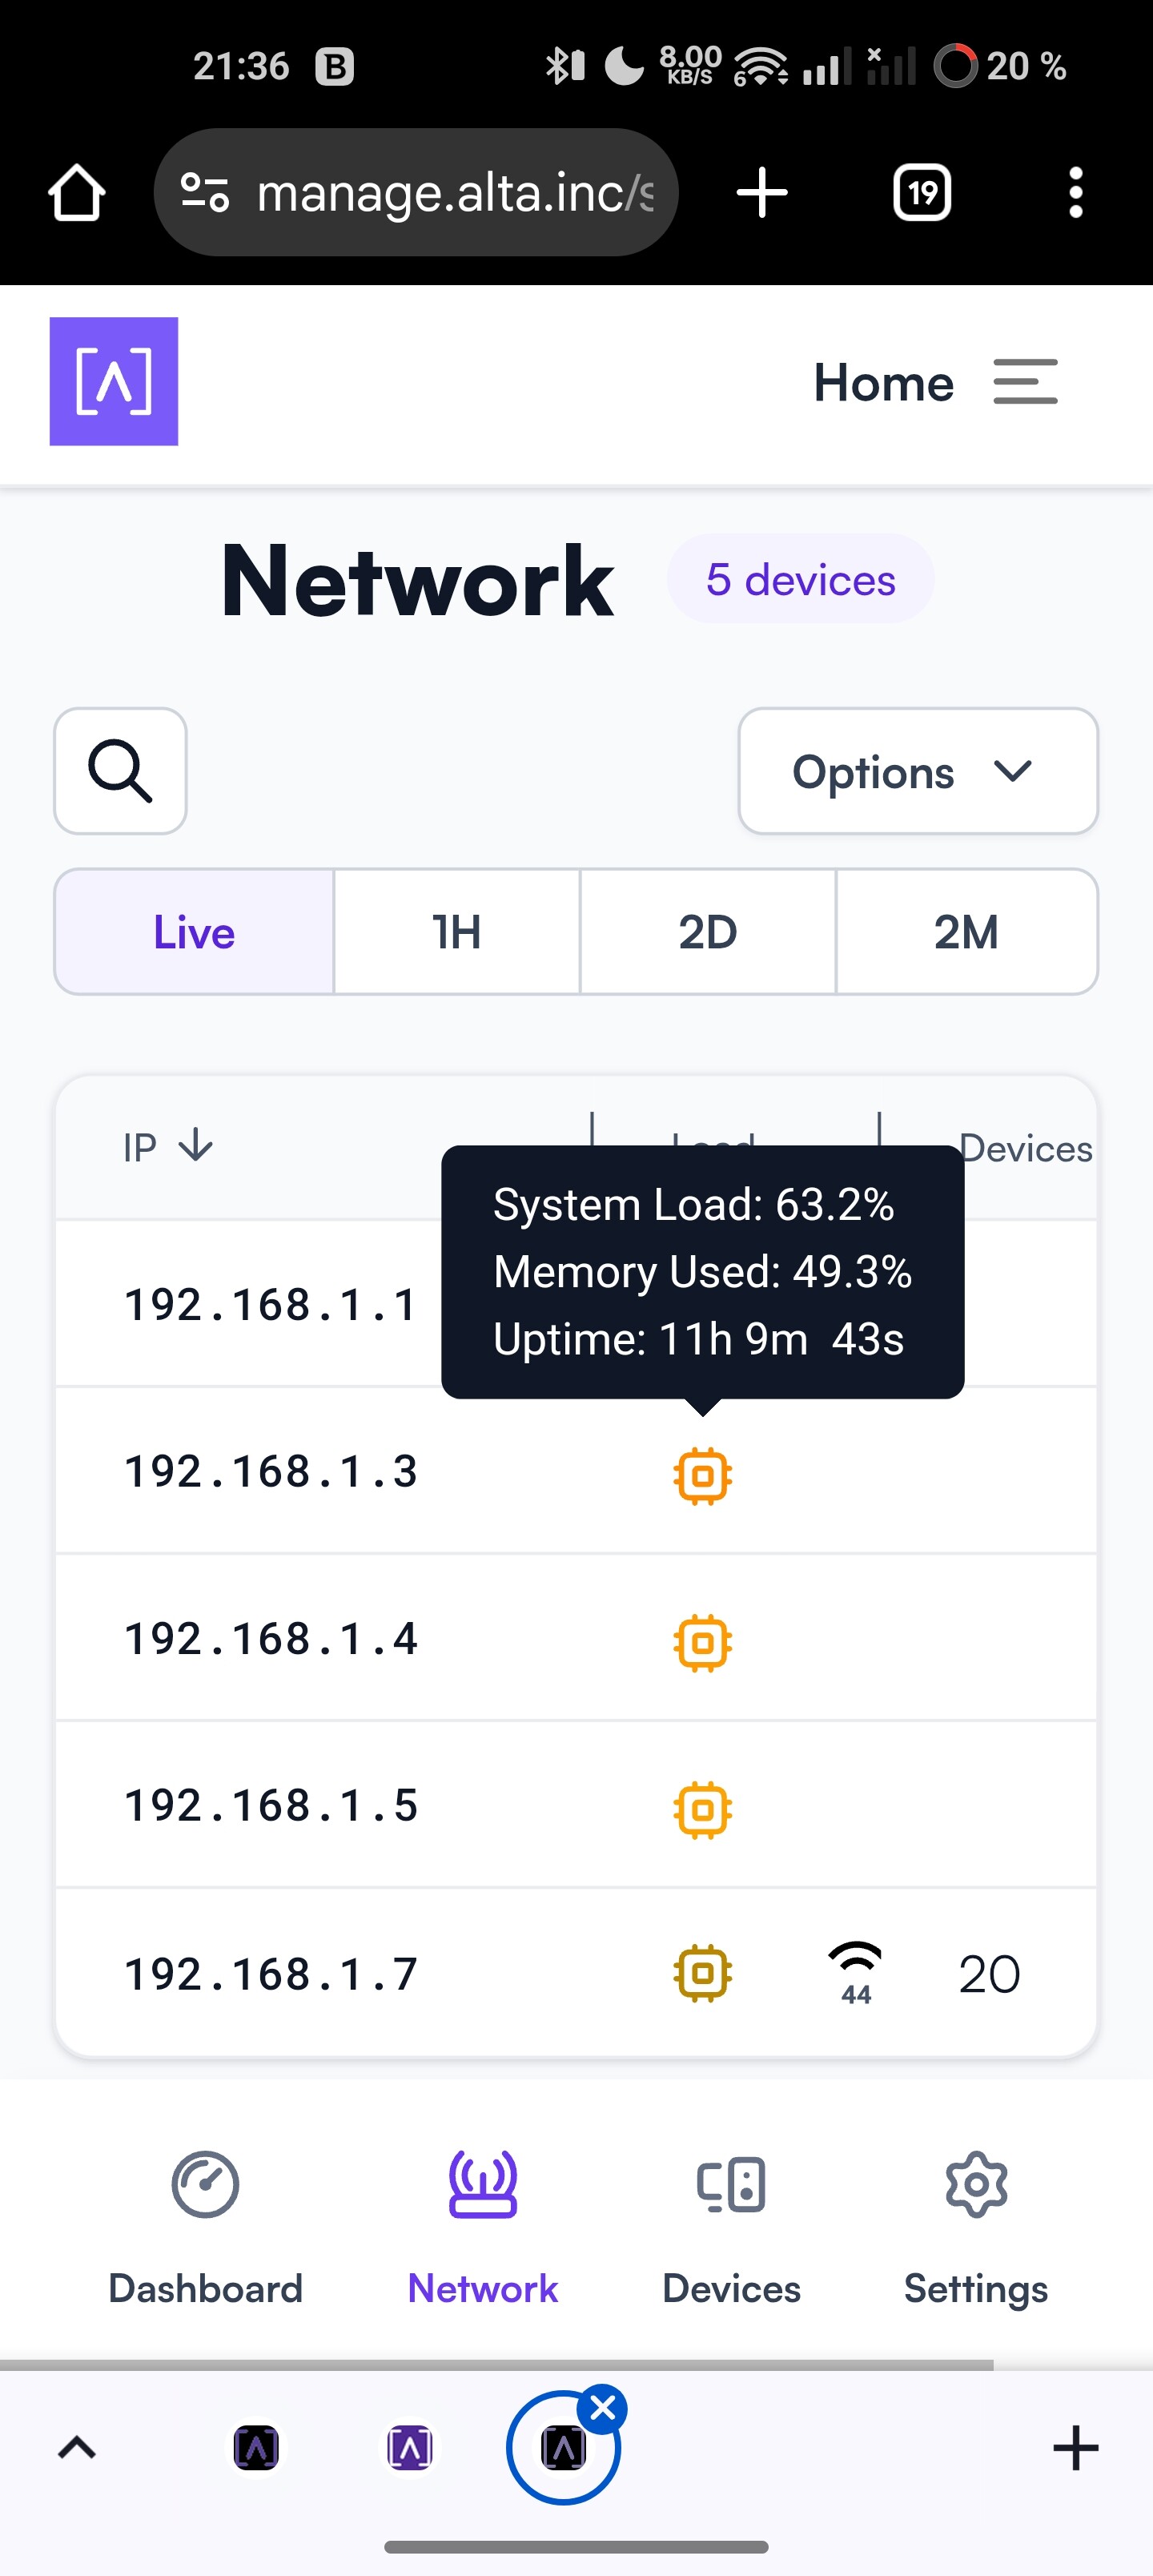
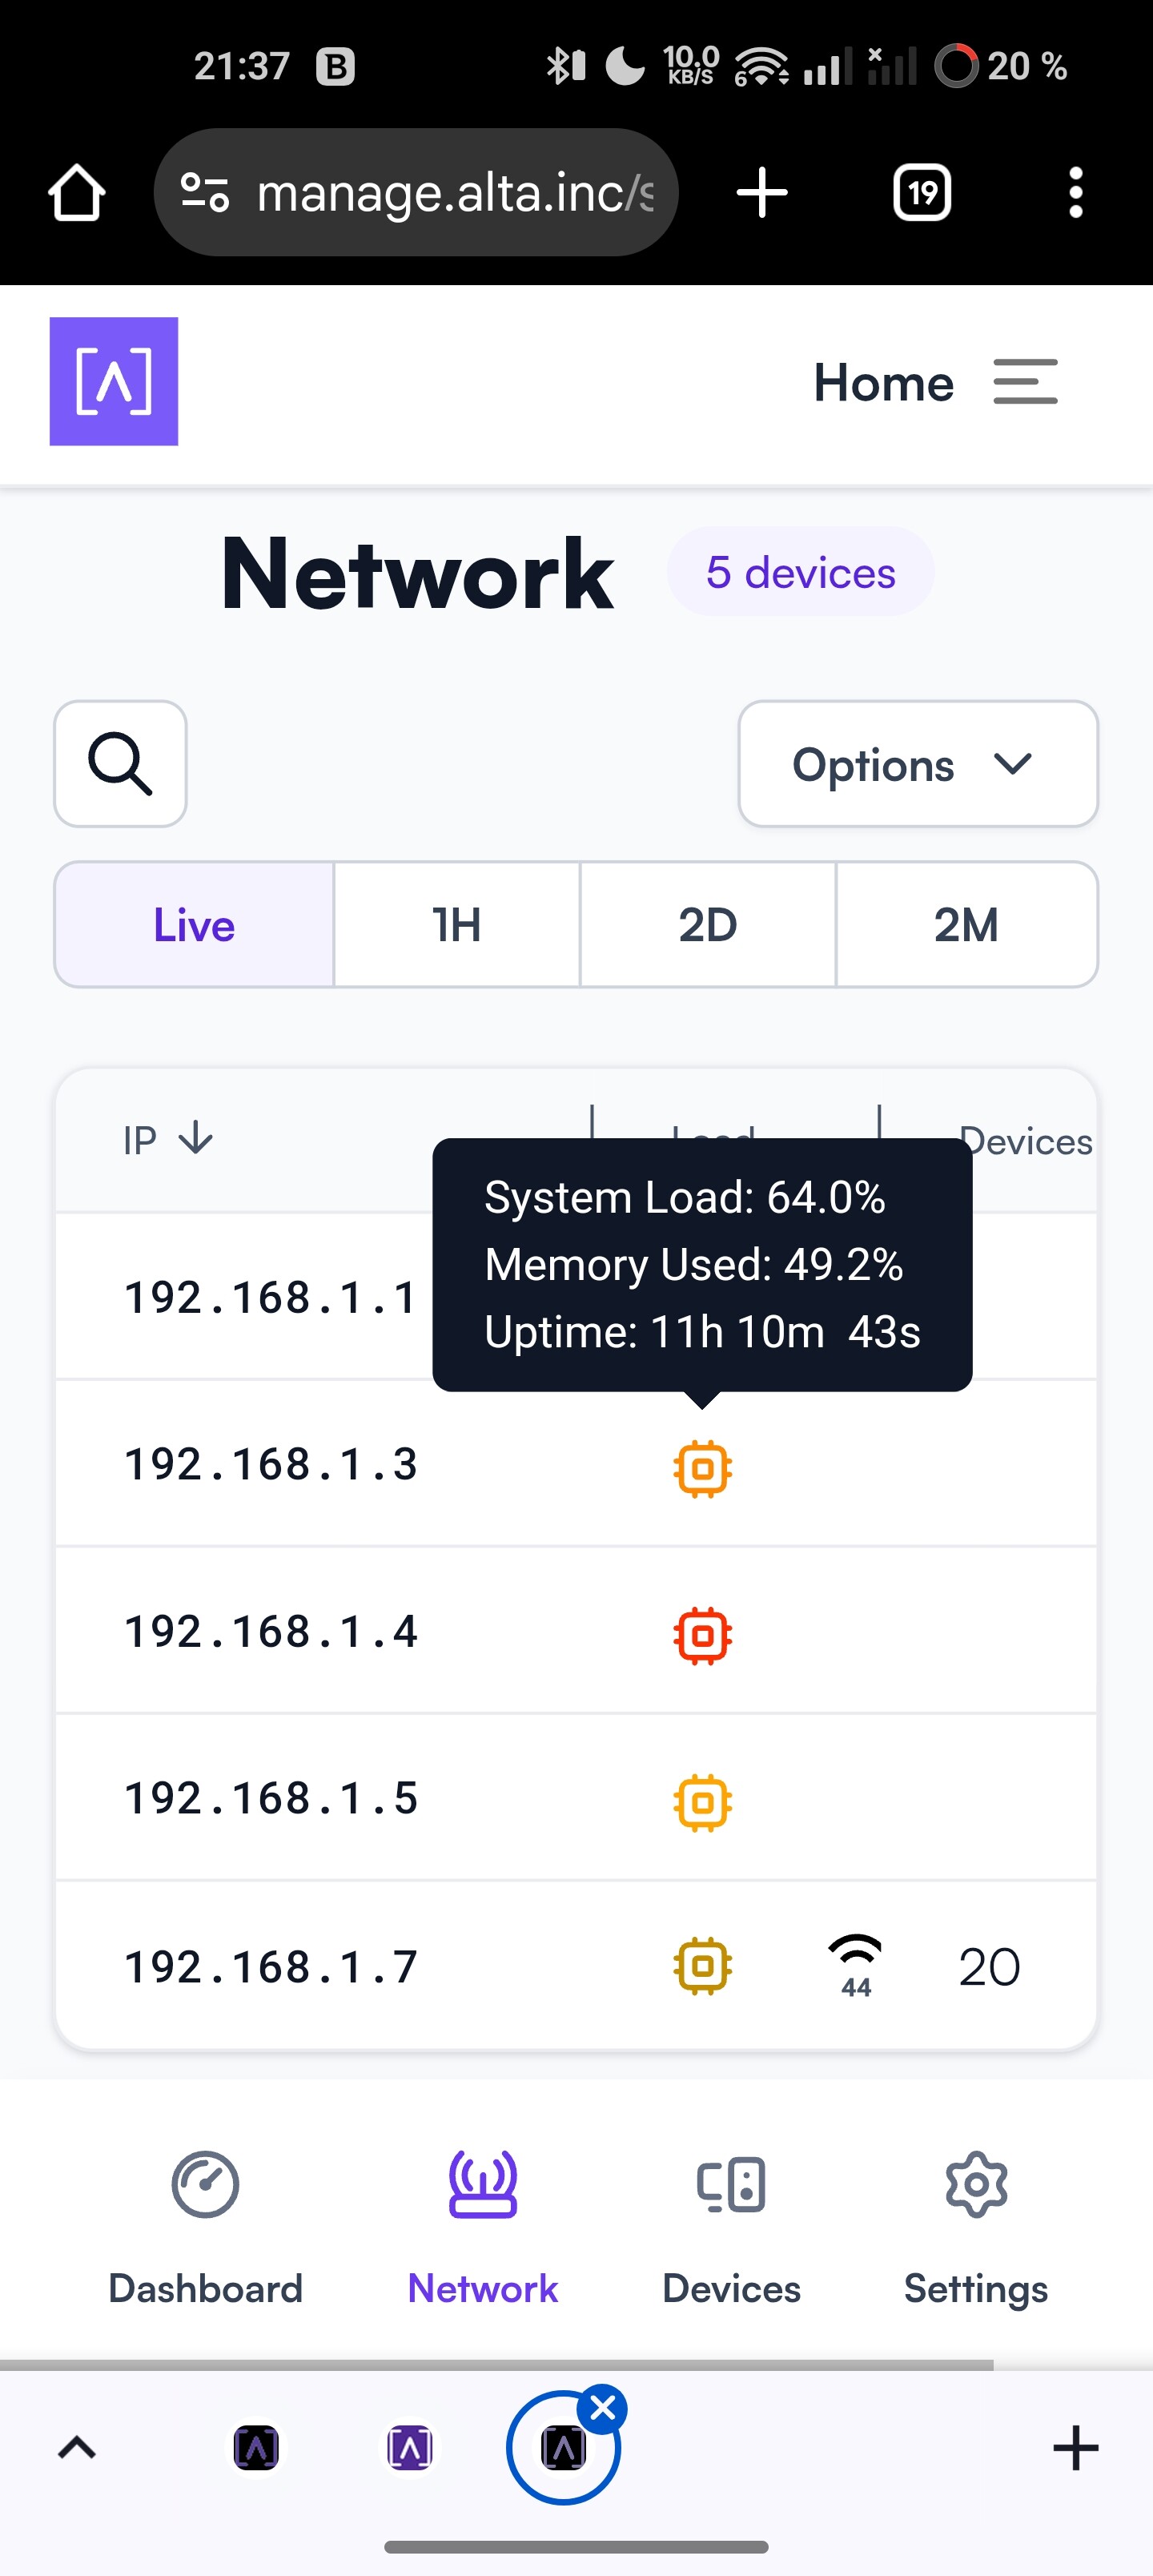
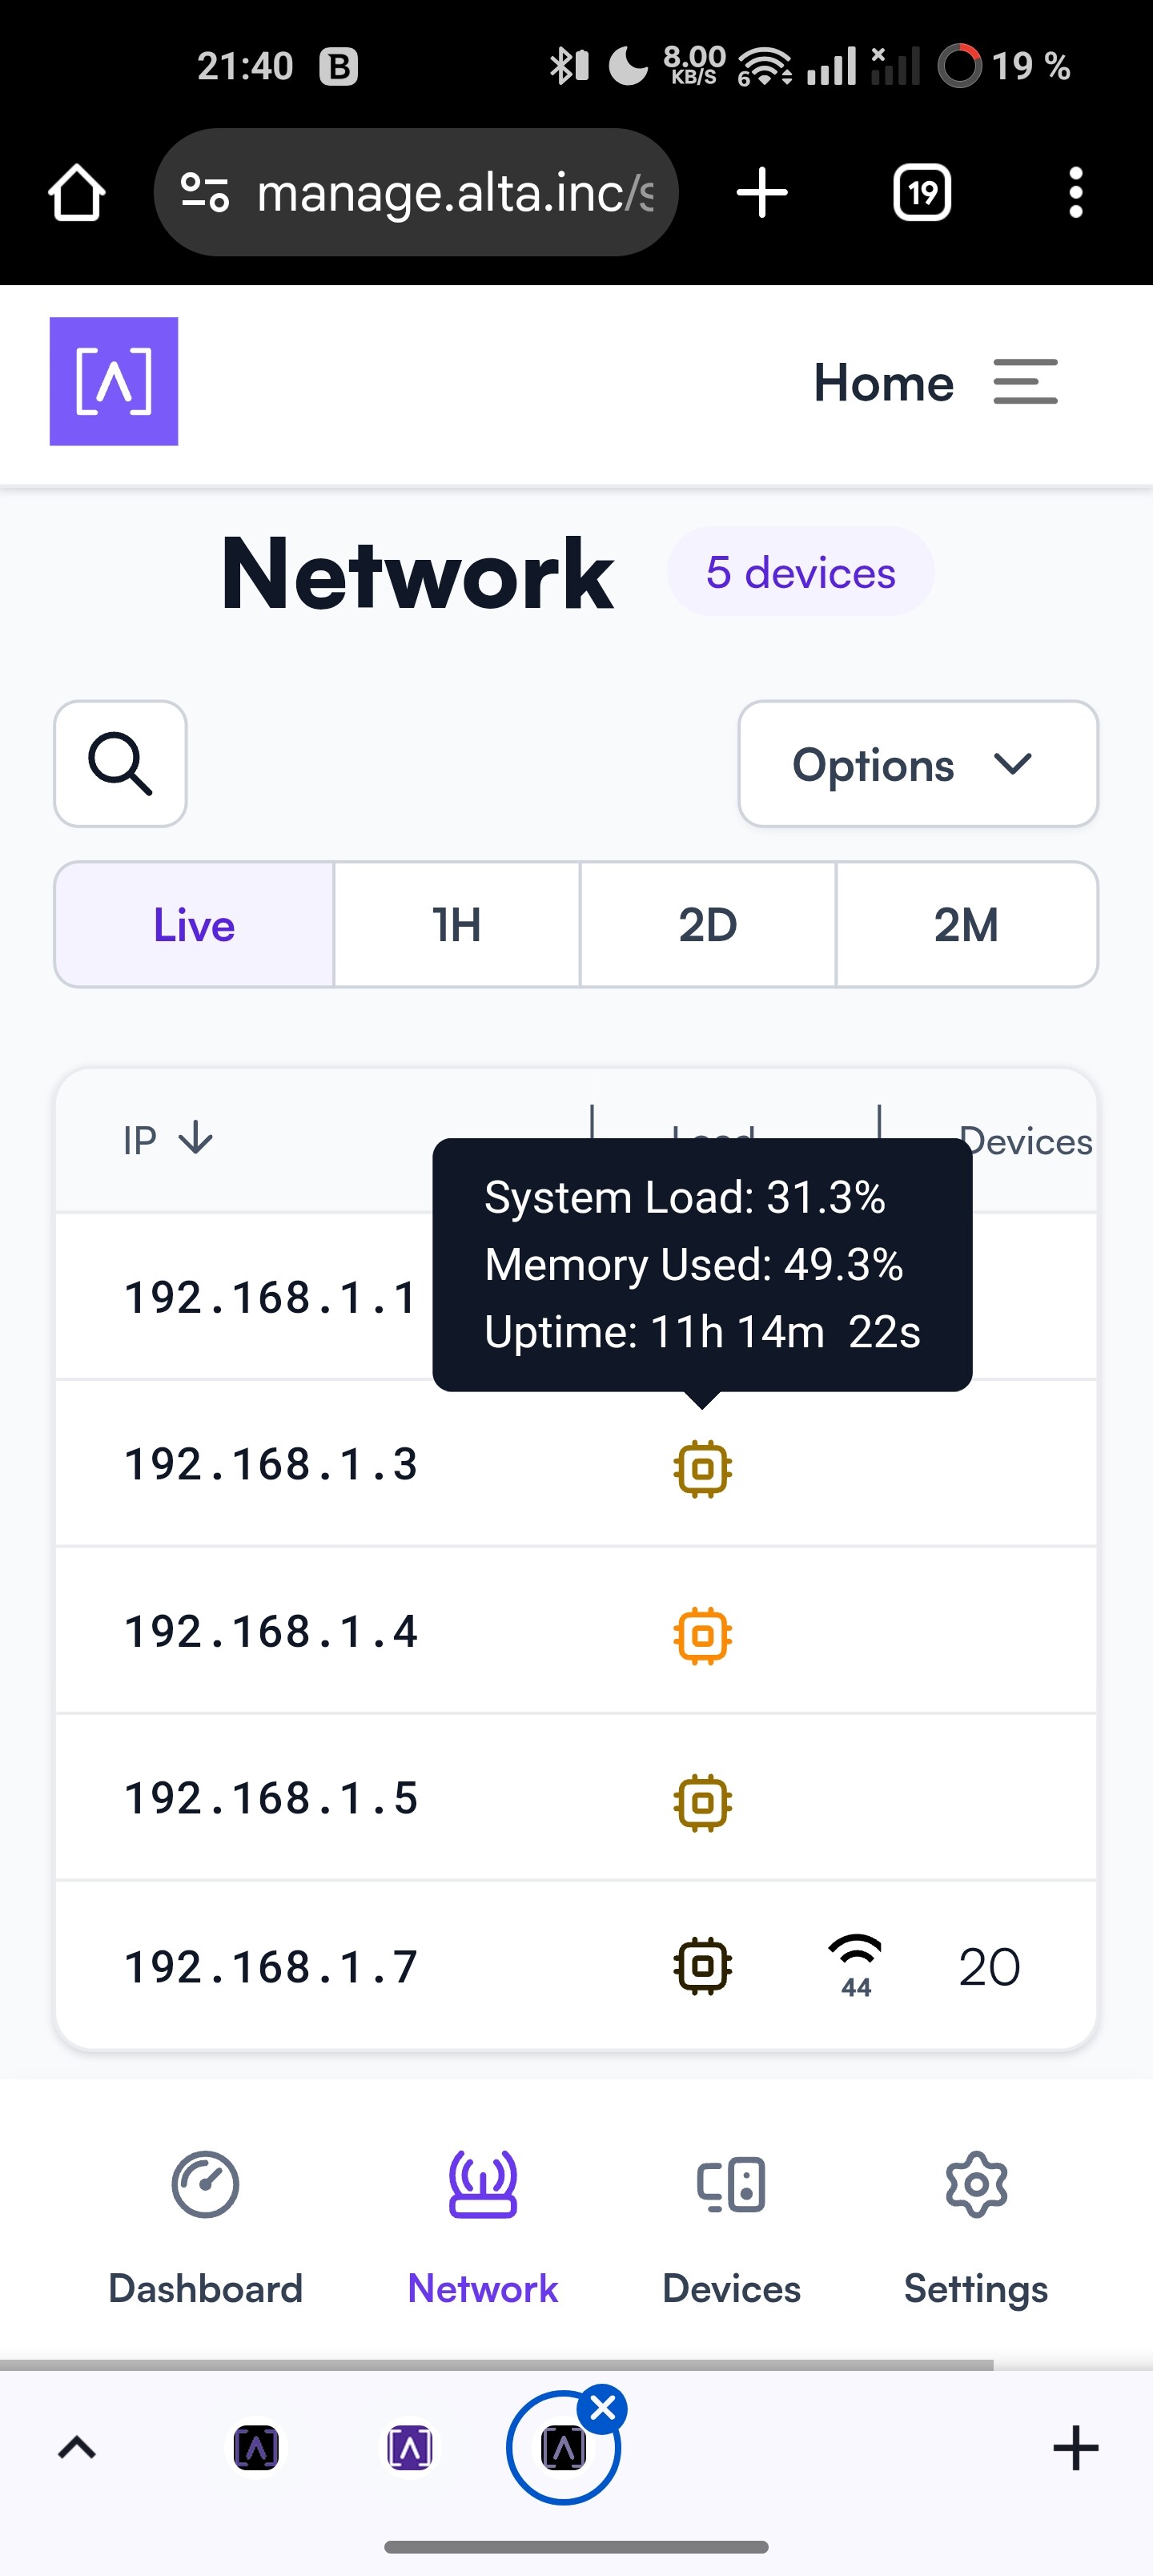
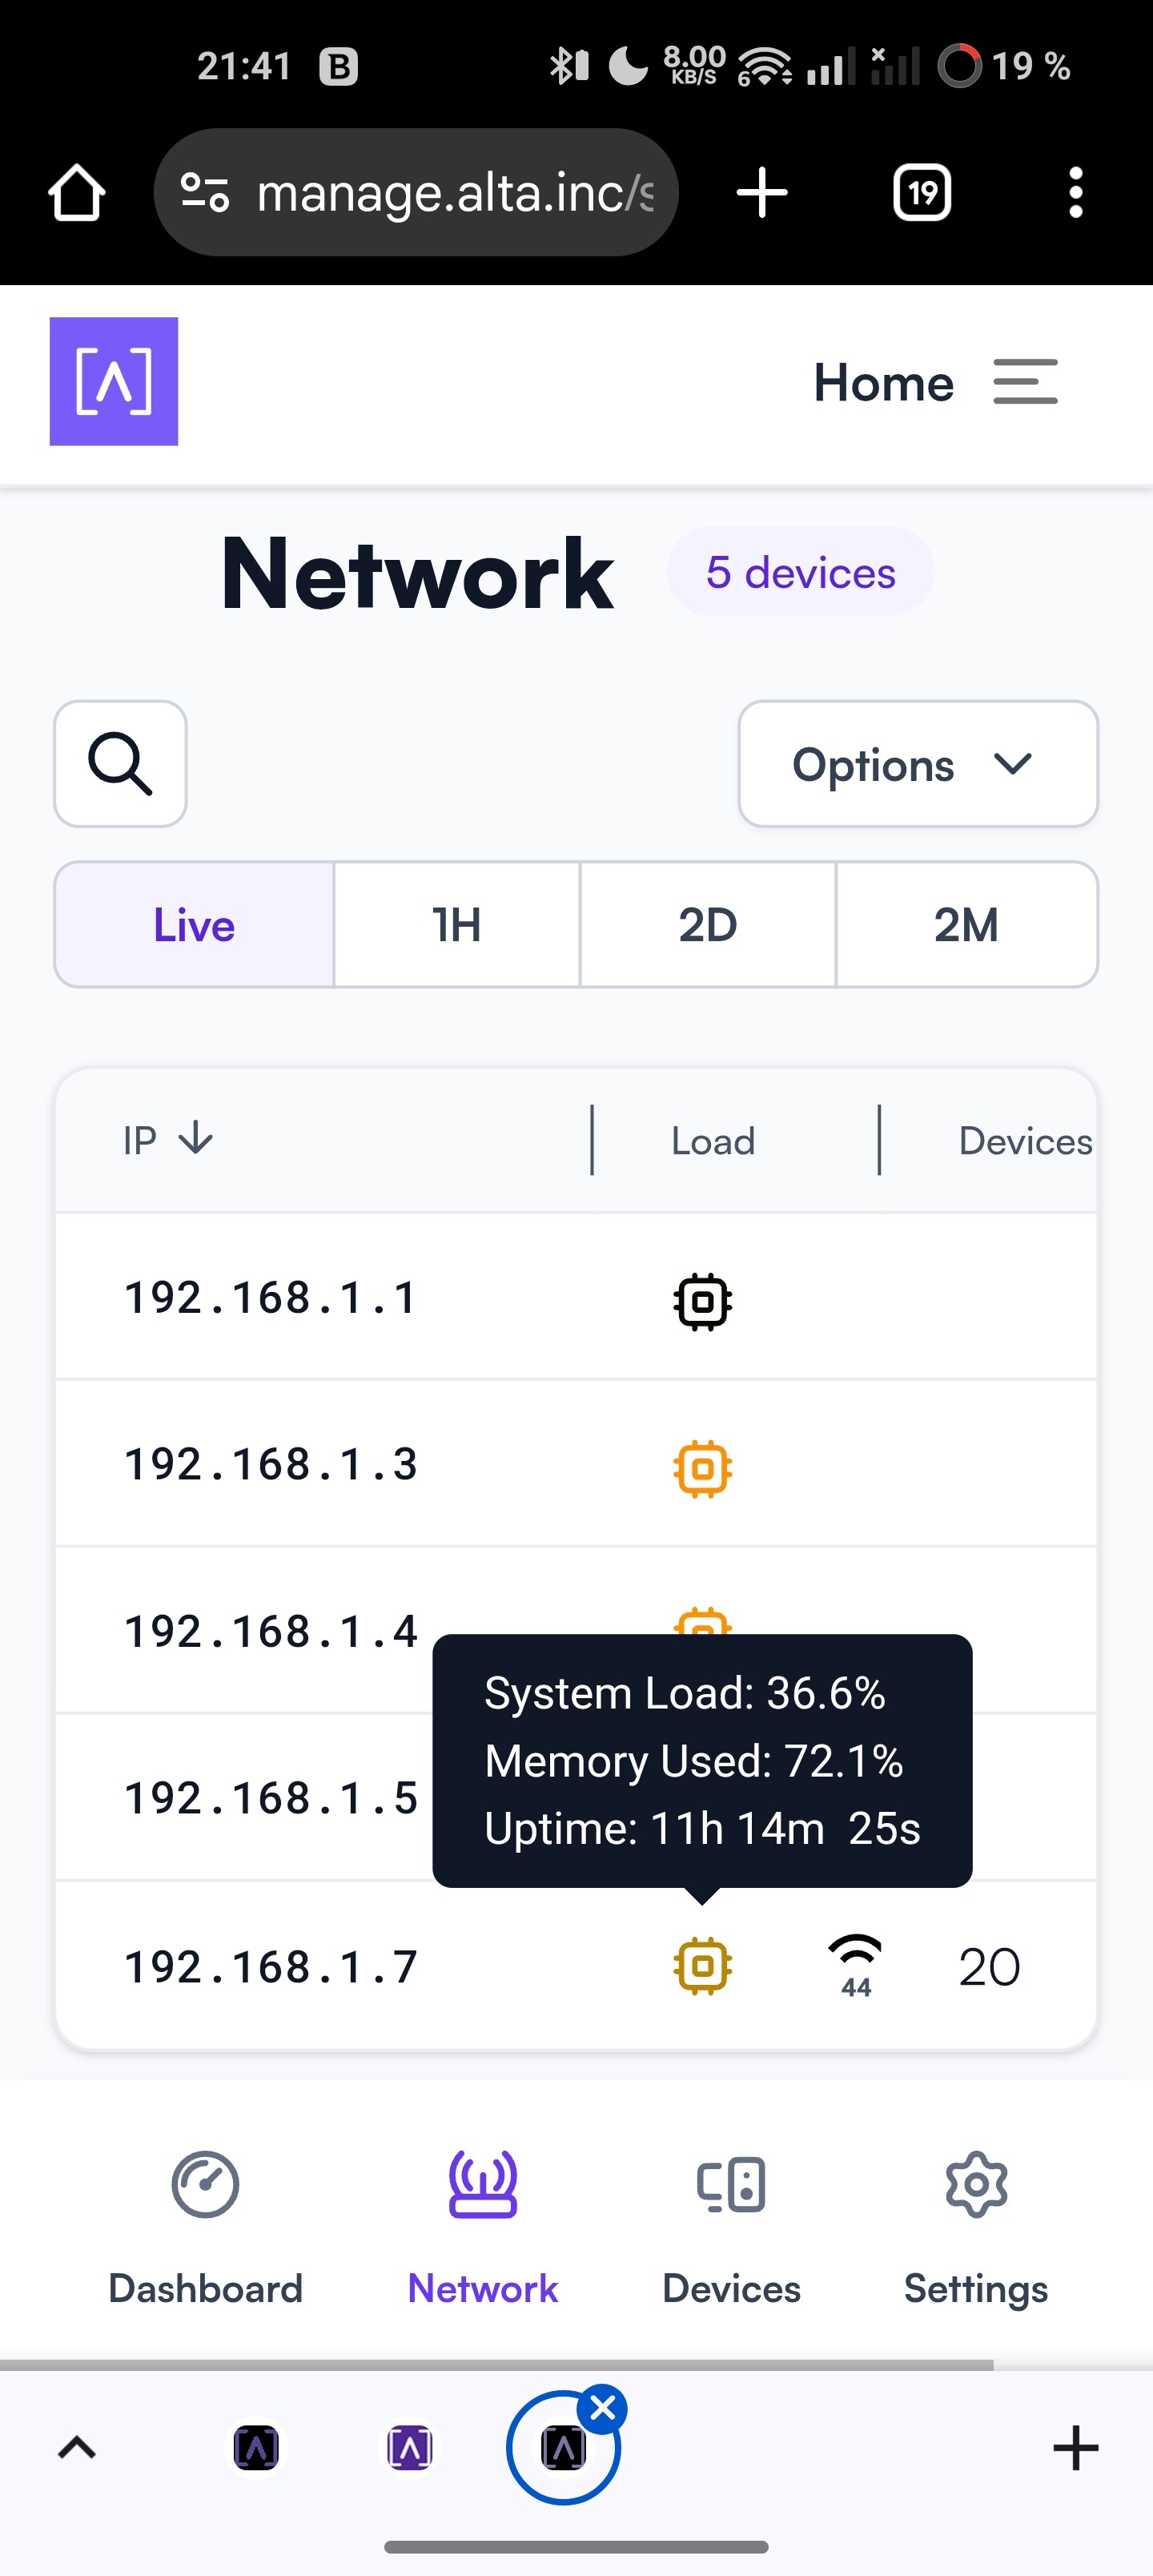
Did a bit of testing, and can confirm the stats by @BeardedTaz. Both Web UI and monitoring top via SSH. My S8 performance stats are very much the similar when the entire network is more or less idling. RCSTATS seems to be the sole driver of the average and peak CPU utilization. The S8 is continuously presented in UI at yellow levels with very frequent peaks at orange and slightly less frequent red levels.
For what it’s worth … I noted that the S8 Uptime in UI changed to a question mark the very second before 75-85% peaks.
Also, numbers doesn’t seem to be affected at all by a 800-900 Mbps iperf3 running through it. If anything, I might have seen less frequent high peaks.
As for any degradation, it is not very conclusive for my setup, I can’t see any obvious decrease in speed or packet loss for iperf3 tests (through S8), or any obvious latency increase or packet loss for a once per second ping (to S8 or downstream device). Performed testing from Android device with a bit of jumping back and forth through windows… By the way, is pinging and iperf3 part of a fair test procedure? And by conclusive I mean I have seen some minor issues but can not really say of it is related or just part of normal behaviour.
System setup from Android client to iperf3 server is:
Route10 - AP6P - Android device
|
Switch S8 - iperf3 server (NAS or SBC)
FWIW: I had another two S8 picked up and unboxed today and can confirm they also behave the same in terms of system load peaks.
Edit: Nothing more on any latency or connection issues, BUT, I noticed that the peaks are very synced throughout all my now three switches and also the AP6 Pro. It occurs once every 60 s. See attached screenshots below.
Was this problem ever solved? I am experiencing the same. And if any device is at 100% for too long it disconnects. This is true of switches and access points. But especially access points. I can ameliorate the problem by adding any device and waiting to add the next. But I still have the disconnects, and why does the algorithm not prioritize staying connected over anything else?
Replying to my own post. The recent update did help with the access points. But now the switches disconnect and of course take down all the access points connected to them. I have investigated and discovered a loop, which I remedied, and other issues. But the problem persists. Does anyone have a solution?