Hello! Lawerence Systems noted APs use an OpenWrt base, which is great to hear.
I was curious Alta or others have tested latency under AP load (e.g., many streams, heavy bandwidth usage), particularly for bufferbloat on the AP alone?
We currently use TP-Link’s Omada EAP 660 HD access point, but we’ve noticed it has just atrocious bufferbloat. At 1.2 Gbps 5 GHz / 80 MHz connections, we’re racking up 100s of ms of additional Wi-Fi latency under AP load.
Our router is an IQRouter Pro with symmetric Gigabit CAKE, so all wired clients have less than 2ms of bufferbloat. But Wi-Fi clients connected to the Omada AP are worse than our Synology Wi-Fi 5 clients.
Has anyone run bufferbloat tests on Alta APs (ideally, fed by a router with strong SQM to remove that variable)? Are they any better / worse?
Your post has me curious. I will be happy to attempt running this test a tomorrow using newer laptops (circa 2023, 2022, and 2021). All devices have WiFi 6E chip.
Ah, that would be so kind of you. Thank you for sharing; I think it’s also a helpful reference point for Alta & Alta owners.
I did a couple tests following the directions from this website.
Generally speaking everything was within the norm.
When I was using speedtest.net, the ping times did jump from a normal of 21 to 31 ms to 60 or 80 and as high as 176 ms.
When I was using fast.net, the ping times did jump higher. 50, 60, and 200 ms. A second time the higher jump was 132.
When I have more time, I want to review the tools reference on the page. I want to test a little more but I have prior commitments this morning.
While I think using a ping to an internet site like google and a speedtest via speedtest.net or fast.net is a good start, I want to remove the Internet from the picture and use servers within the local network. Flent and netperf may give better measurement than the way I was previous monitoring the traffic.
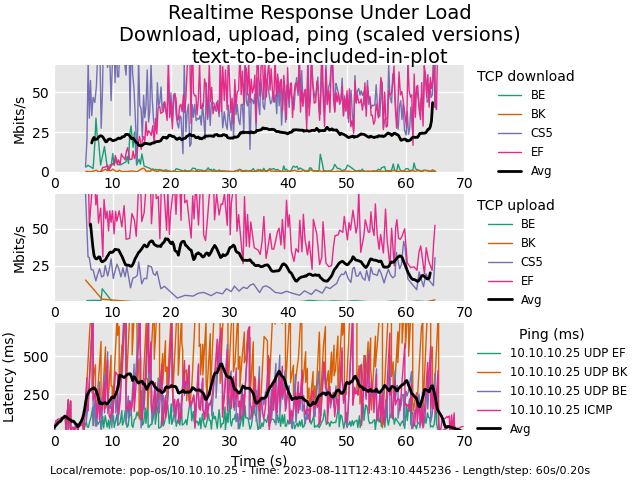
I ran this command
flent rrul -p all_scaled -l 60 -H 10.10.10.25 -t text-to-be-included-in-plot -o filename.png
The new devices were laptops having the same Intel wifi6E chips. Each laptop was connected to the AP6-Pro.
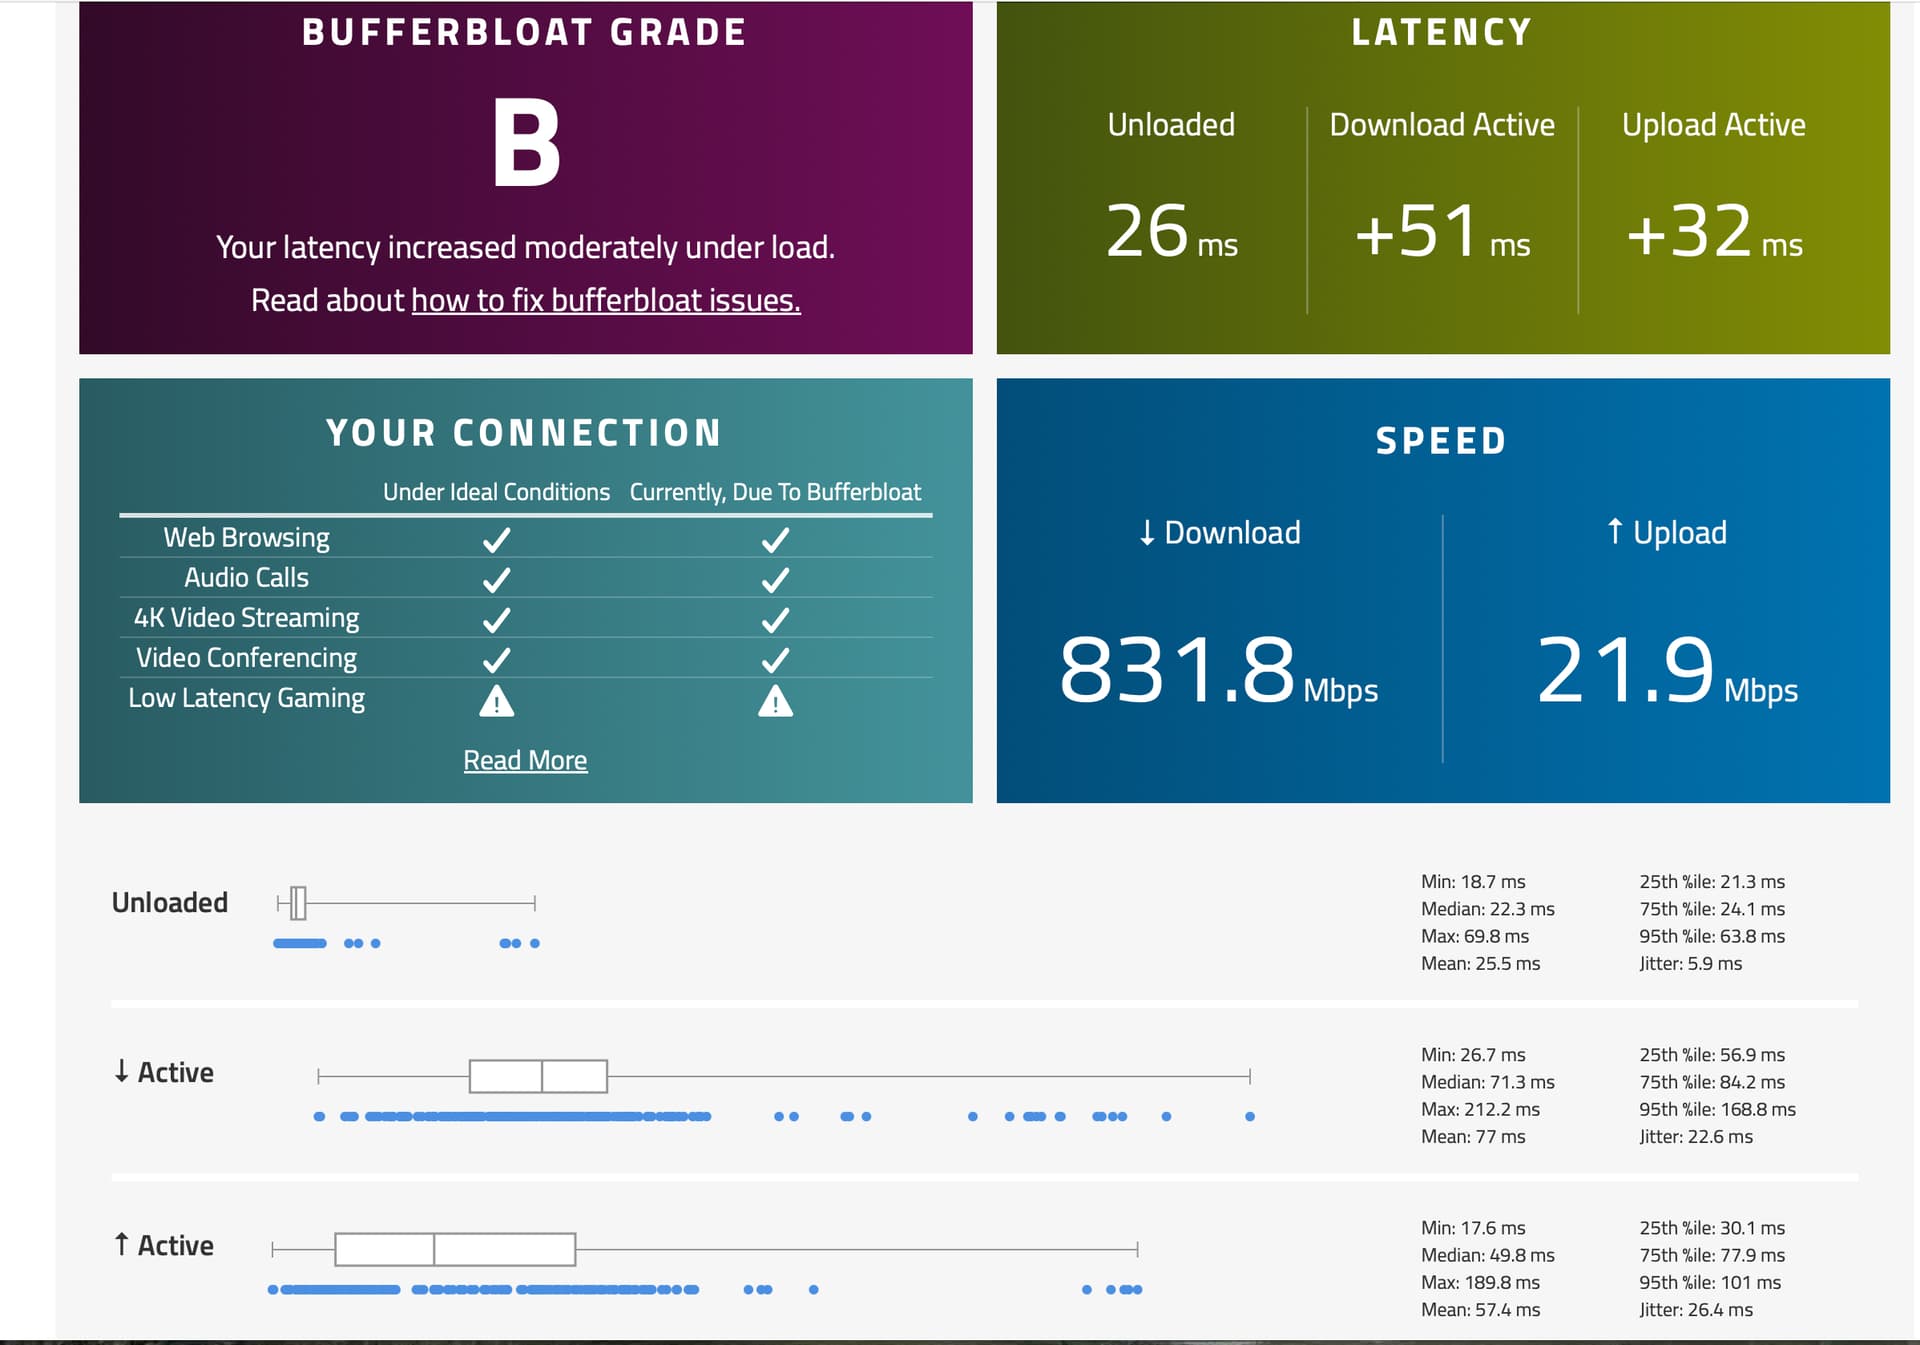
Here is my test to throw in the ring! This was performed as a “real world test”, meaning that I did not disconnect everything in the house from WiFi and only perform this test with one device attached. This was on a Saturday morning with 4 other members of the household watching Netflix and YouTube and such on their iPads. There are 21 WiFi devices currently on my network. As of this test, 7 of them were connected to the Kitchen AP I was connected to. My internet connection is Xfinity Gigabit down 20Mbps up.
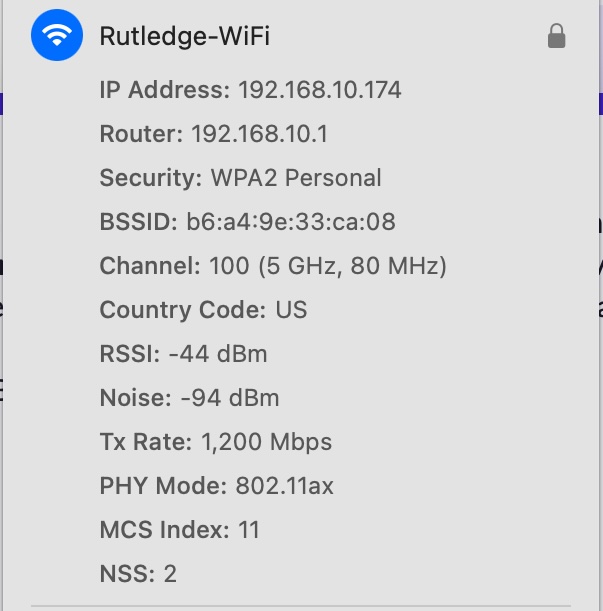
Test was performed using my M2 MacBook Air. I was sitting at my kitchen table. Attached are pictures of the buffer bloat test, and my WiFi connection information.
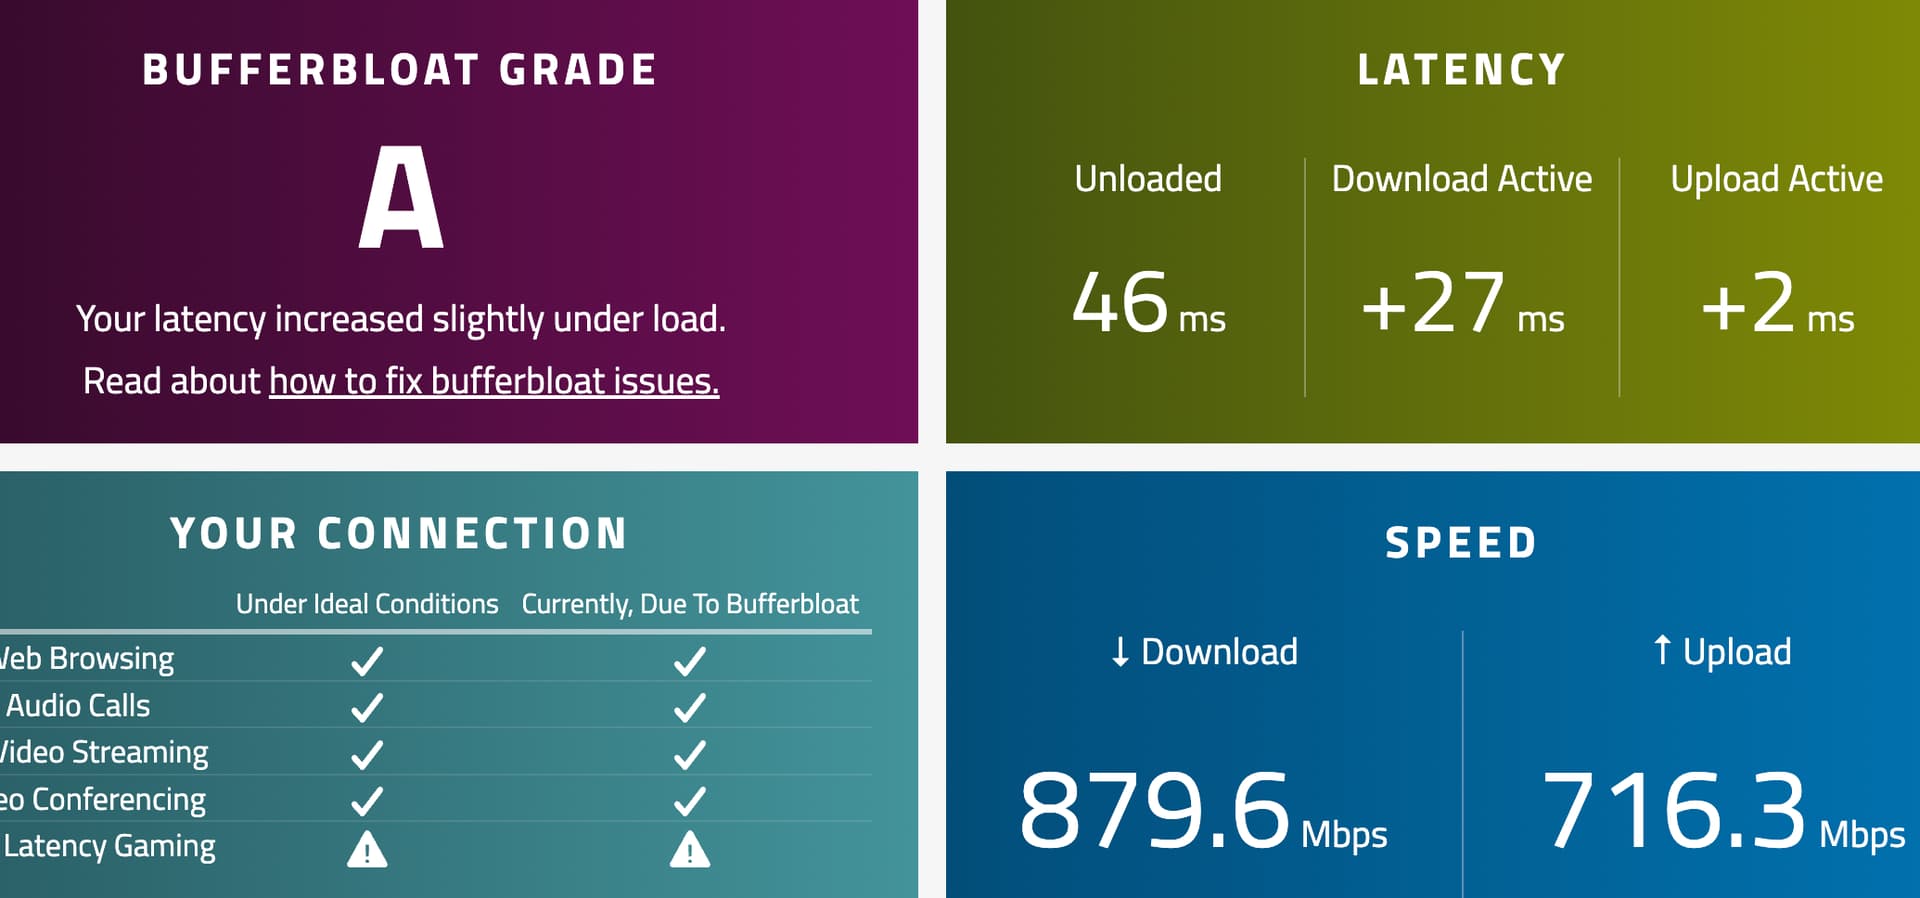
I’ve never used that web-test before, but I just got this from the other room with a -54dBm signal:
That’s awesome! Keep in mind that my internet service has terribly high latency on its own, so don’t take the “B” as a bad thing. With … ahem … another vendors APs I consistently got “C” and “D” grades.
The test via the website has a few flaws as rutman286 pointed out. A website is grading your service based on the internet connection. Also there is no way to know what is the ceiling on the website. Some internet vlogs (like Linux tech tips) have pointed out that many commercial internet sites cannot handle > 1GBe internet speeds.
I focused on a local LAN tests because I expected the access point to have more local traffiic than Internet traffic. Also, I do gap the internet traffic for most wi-fi devices.
I took a look at the AP6-PRO supported data rates. The AP6-PRO unit is going to have more traffice within the LAN than over the Internet due to the software development/testing within this lab environment, I am interested more with the total throughput within a LAN vs WAN.
| SUPPORTED DATA RATES |
|
| 802.11a/g |
6 Mbps to 54 Mbps |
| 802.11b |
1 Mbps to 11 Mbps |
| 802.11n |
6.5 Mbps to 600 Mbps (Up to MCS 31) |
|
|
| 802.11ac |
6.5 Mbps to 3.4 Gbps (Up to MCS 9) |
| 802.11ax |
2.4 GHz: Up to 573 Mbps
5 GHz:6.5 Mbps to 5.8 Gbps
(Up to MCS 13) |
Bufferbloat.net recommended using Flent because Flent can work up to 40GigE. There was a suggestion to use RRUL tests. The test can run multiple netperf session simultaneously; it will create a heavy load.
Given the AP6-Pro is limited by 1 GBe networking, then the Waveform Bufferbloat Test is going to give a good score based on:
- Cloudflare’s backend. Therefore the closer you are to the cloudflare the lower the network latency.
- max bandwidth on the web platform hosting the site
- the end user internet speed (from your ISP modem)