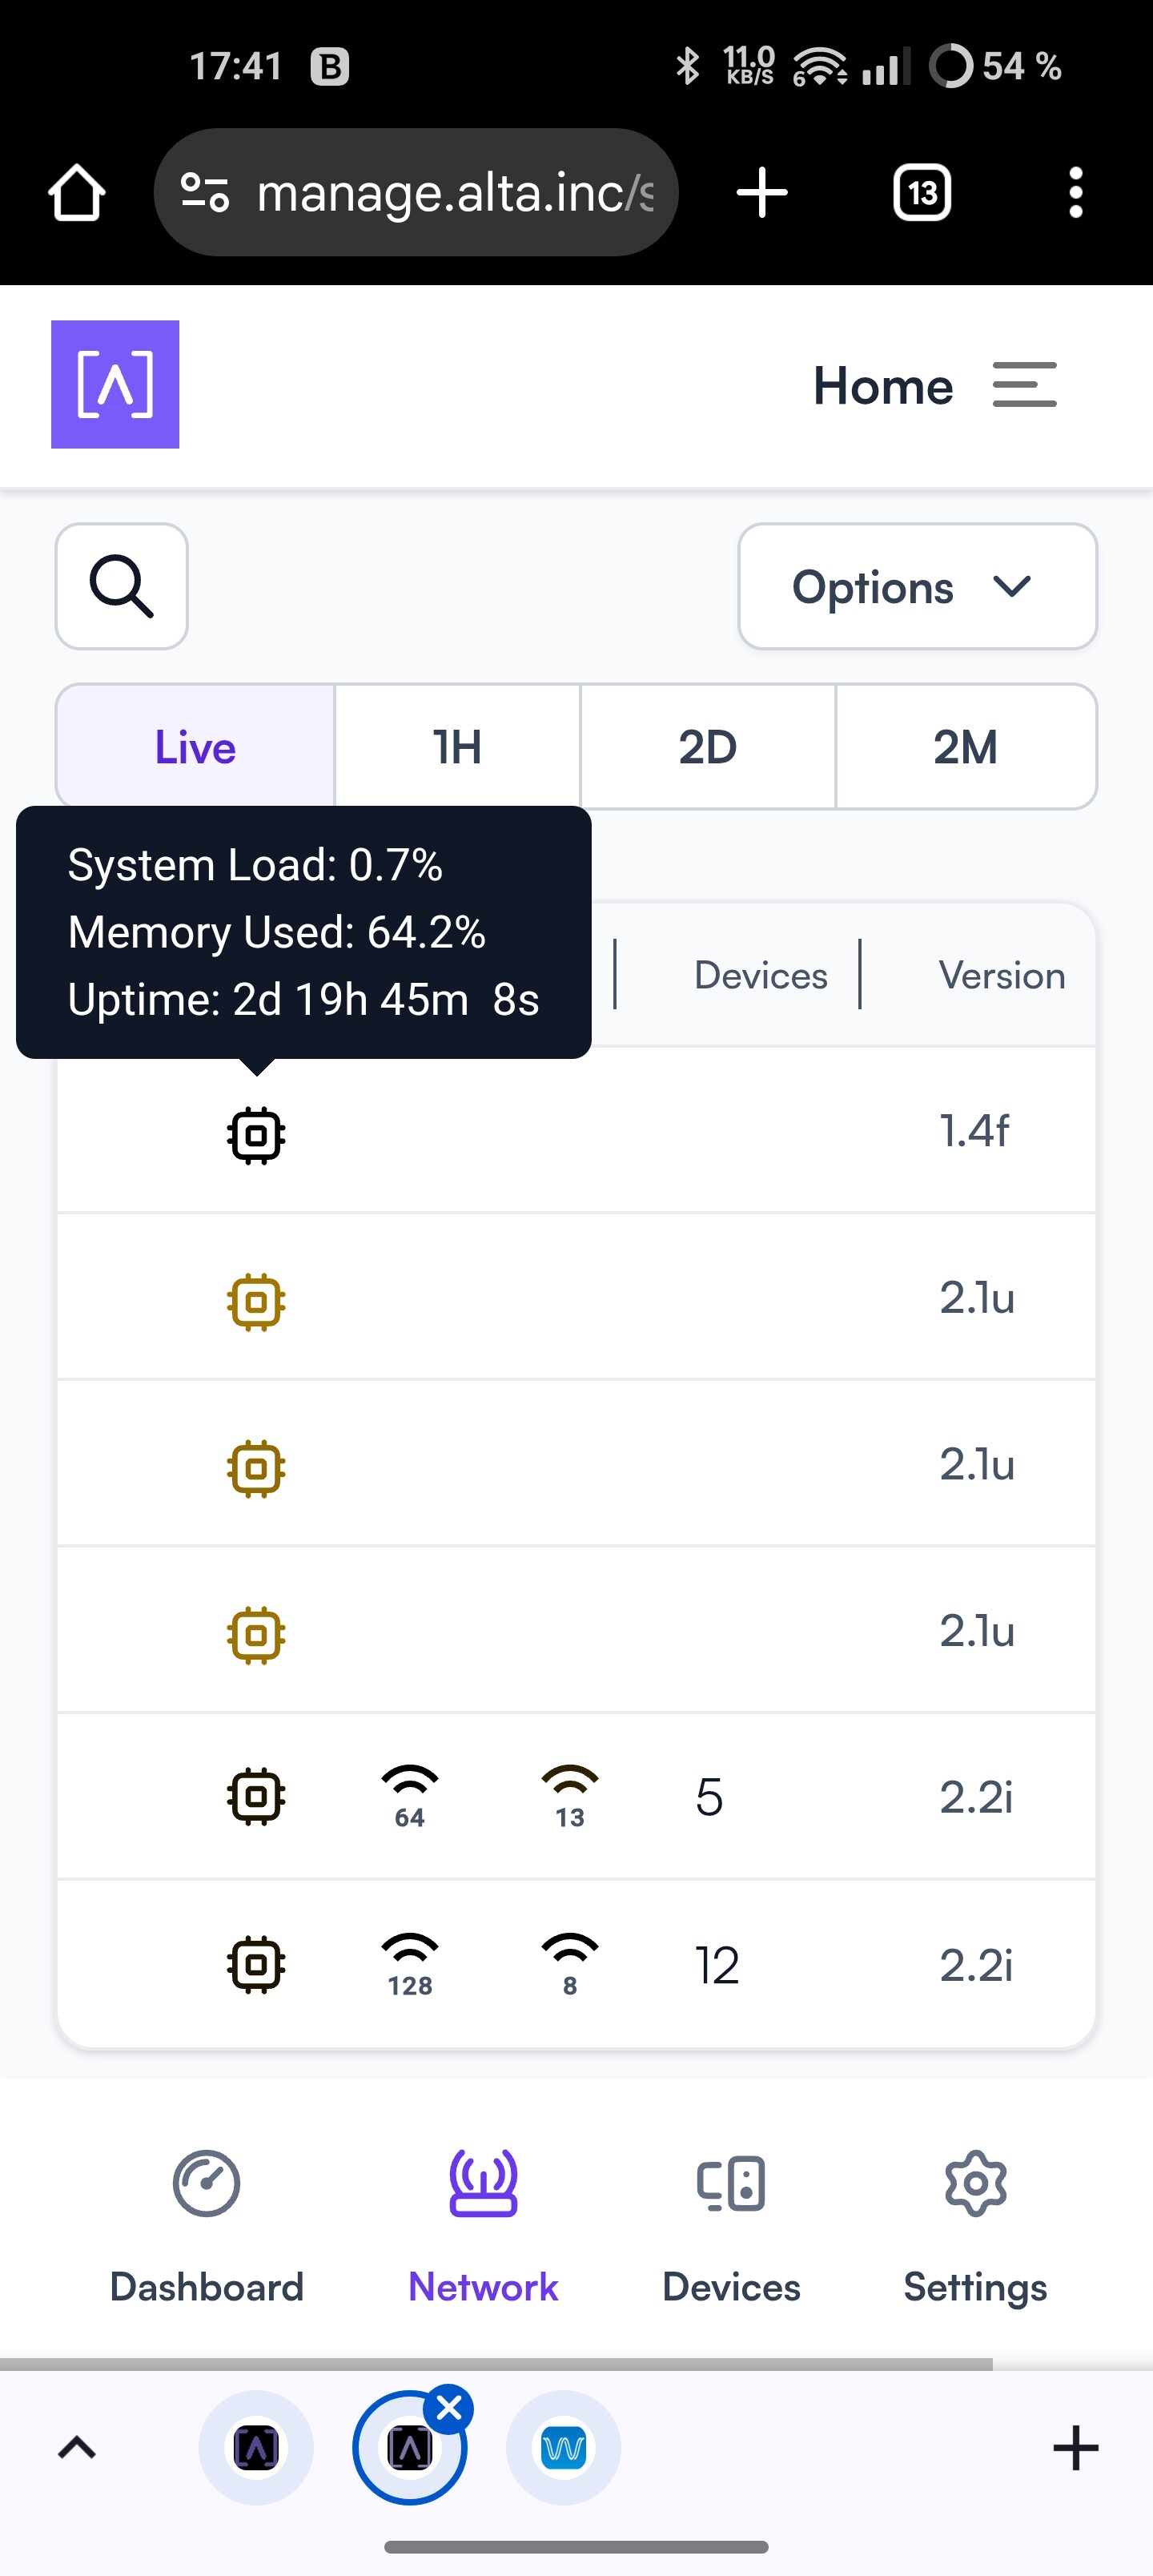
Apologies if this is available and I just haven’t been able to locate it, but would it be possible to implement being able to view the uptime of network devices in the controller? For example, being able to see how long an AP has been on and also how long it’s been connected to its controller (either cloud or local).
It could start as a simple counter, such as the AP or switch has been on for 6 days and 7 hours and has been connected to the controller for 5 days. Having this in graph form I think would be even nicer if possible.
I think it could be very helpful when it comes to troubleshooting and getting a quick idea of stability at a site if there have been problems reported.
Thanks!