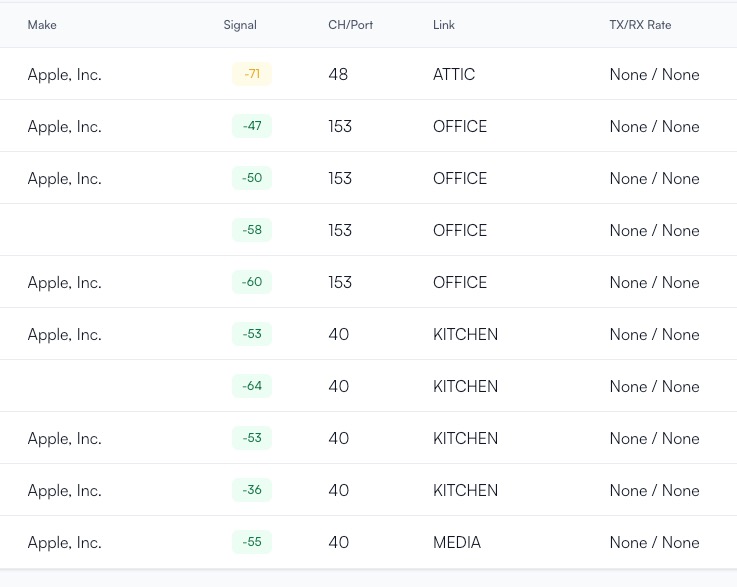
Only use web, not app. TX/RX Rate values sometimes show, most times not. When not there, None/None shows.
Have tried different browsers, different computers, clearing caches, new user profile on computer, Windows & Mac computers. Same behaviors seen in all scenarios.
Have tried various combinations of configurations within SSID, for APs tried various combinations of power/channels…same symptom no matter what. Single AP broadcasting or multiple, same symptom as well.
Latest firmware on APs (2.0e). Only have AP6 Pro model.
I see this a lot with my IoT devices that only really talk when I have their corresponding smart app open and am asking for data. My air cleaners for example.
The majority of the devices that are on Alta APs at this time will be Apple based devices. iPhones, iPads, AppleWatches, HomePod. They are all wireless and will not be physically connected to network. They are not offline.
Small update: I’m seeing the same thing on my end on your site. I only have 2 Apple devices on my network, they’re not showing the None/None for rates. I inquired with some other Alta people, they’re also getting valid rates. I’m waiting on a developer to respond to me internally. I just wanted to drop an update so you knew I didn’t forget about you.
FYI…this has been occurring off and on for some time (along with client name recognition being sporadic as well). Can’t pinpoint a time frame of when though. I’ve deleted ssids and forgot the WiFi network on client devices in the past to see if there was a relation between those actions and couldn’t see one.
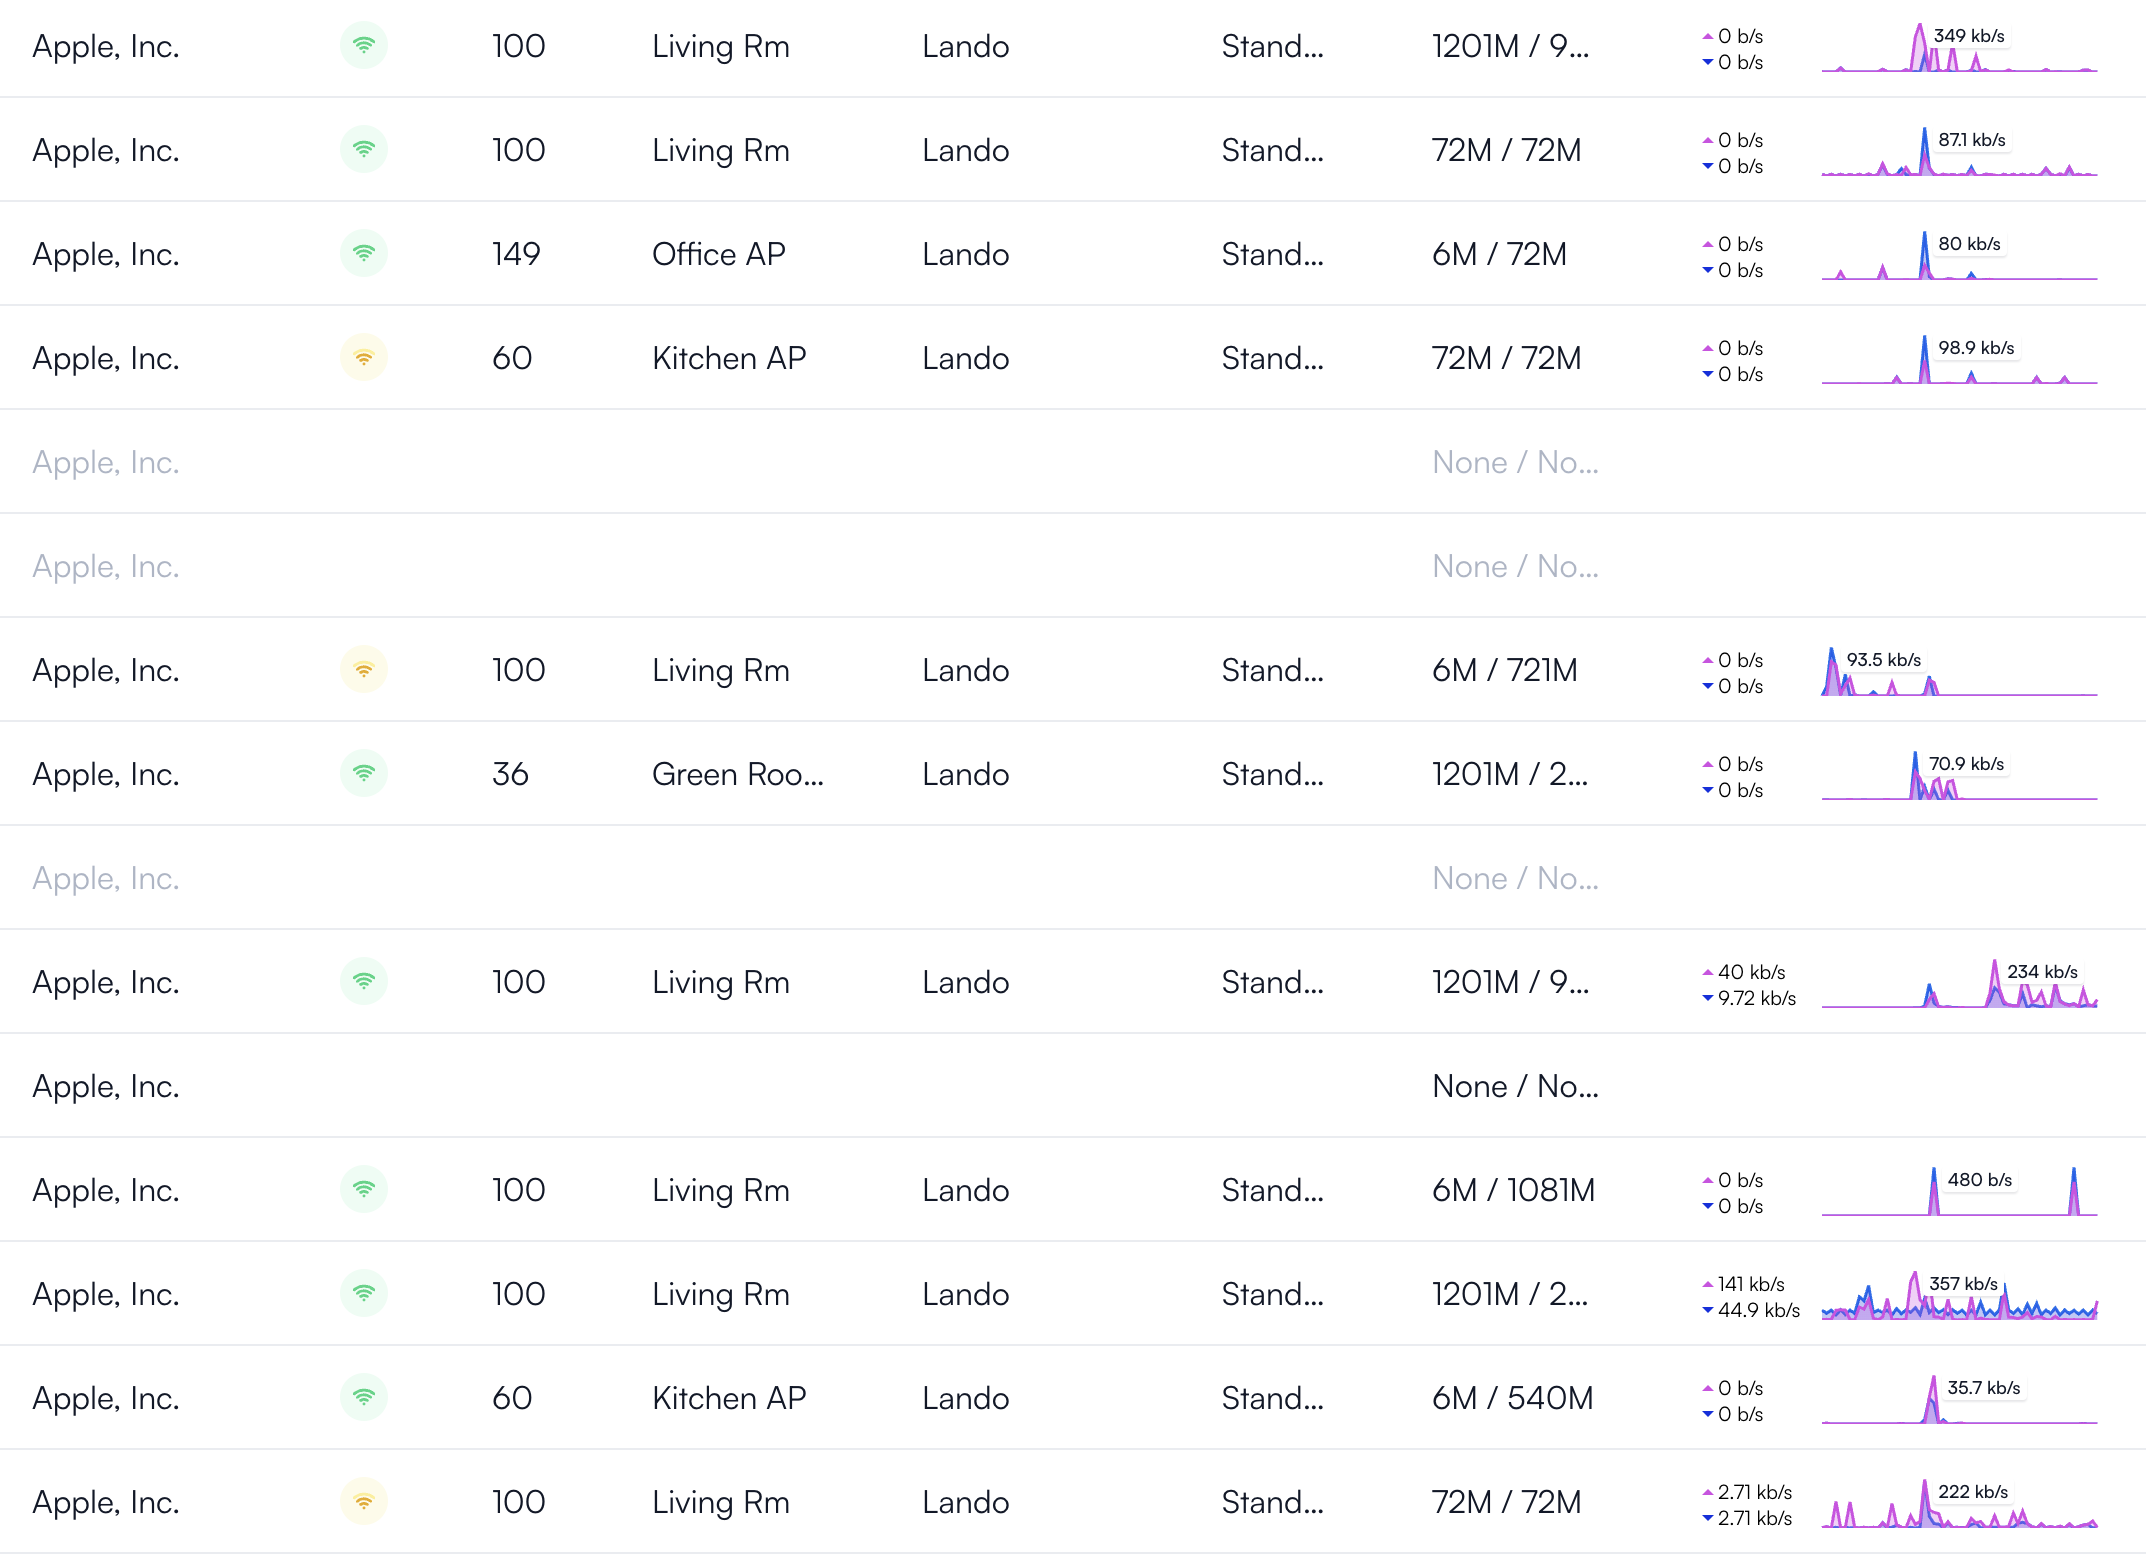
FYI…over the weekend, I enabled a couple of combo (2.4/5) SSIDs. The initial SSID I reported the issue with was only 5G and should have been just Apple devices. Once the other devices (various vendors) started connecting to the Alta APs, some (but not all) of the 2.4 devices are showing the TX/RX values (seems to be just channel 1 that do not show values for some odd reason), but still any of the 5G based clients will not show the TX/RX values.
Can someone provide details on how the Tx/Rx data is being sent to the Alta portal from the device?
I started from scratch. Deleted existing SSIDs, deleted site, created new site, created SSIDs again. Same issues.
I started from scratch even further. Deleted existing SSIDs, deleted site, deleted account, created new account, created new site, created SSIDs, added APs.
Above with the same issues each time. No Tx/Rx data flowing through.
Then I reset one of the APs (pressing reset button), re-adding to site, created completely different SSID, assigned to that freshly reset AP, connected device to that new SSID, same issue. No Tx/Rx data.
Currently, I’ve moved the wireless workloads back over to Unifi APs until this issue can get worked out. Yes, they report the Tx/Rx data correctly for clients.
@carrottspc We aren’t able to reproduce this in-house, which is why we need to work directly with you and anyone that can reproduce this. From what we’re seeing though, this is purely cosmetic. Are you seeing any actual connectivity issues on your network?
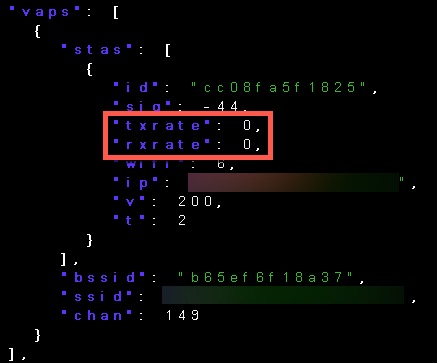
If you want to see what is getting sent from the APs, you can ssh to them, and run “rcstats-mon” to see the raw JSON data.
Is there a way to downgrade AP firmware? I know others have asked this as well. Even from SSH, a client connected shows no data rates.
To answer your other question, no there isn’t connectivity issues. But the indicator of that one thing not working could also lead to other things not working as expected.
@carrottspc The TX/RX rate is simply read from the wireless driver, and in your specific case, is obviously incorrect. We will fix the issue, but please understand that this is purely cosmetic.
If you’d like to try a previous release, please reach out to support and they can downgrade for regression testing.
@Alta-Jeff Reviving this issue. I’ve found that if I (1) create a new SSID, assign to an AP and have device connect to it, the Tx/Rx values will not be seen for that device. And (2) if I modify an SSID, any device connected to an AP will start to have that issue.
The only time I can see the Tx/Rx values is if I reboot the APs, then the values will show.
Lather, rinse, repeat if I do either 1 or 2 from above.