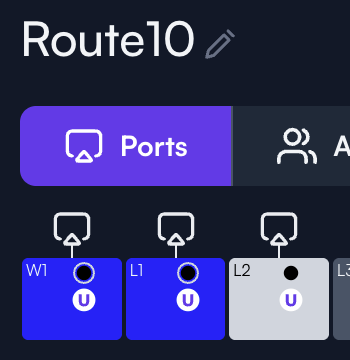
Hi, I have a route 10 connected to the internet via port 1 (RJ45) and then port 2 (RJ45) goes to an alta switch where I have clients connected via cable as well as 3 APS.
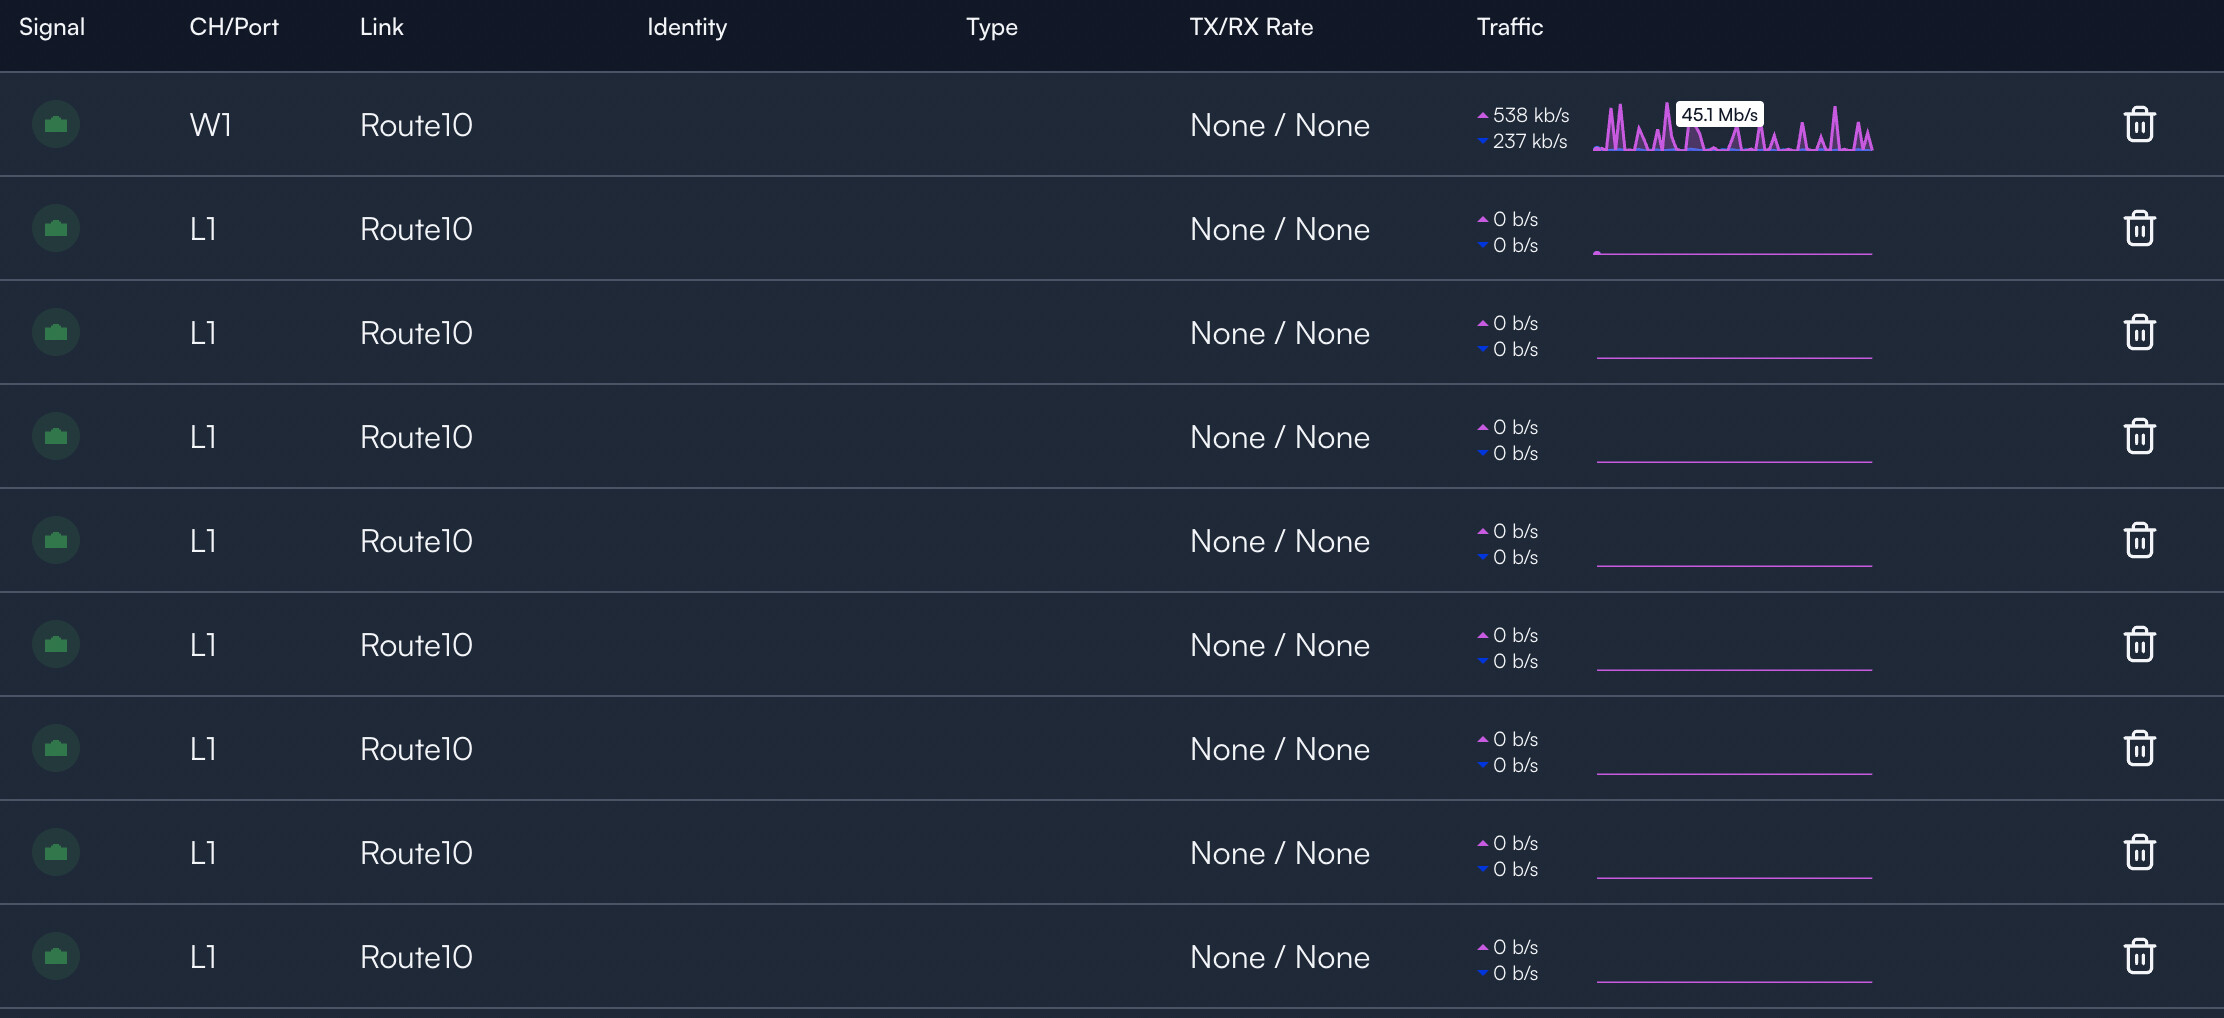
When looking at the clients list I cant see that they have some traffic even though they should pass the router (testing from the internet)…
I cant get my head around this if I have configured this poorly or if there is something else.
It should state Switch 01 here instead and not Route10…
I am see the same problem. Dashboard only showing WAN info.
If I click on Route10 from the network tab , the click Traffic it does show everything there.
Also IPS/IDS just stopped working on May 9th. Not seeing any notifications but it looks to be running??
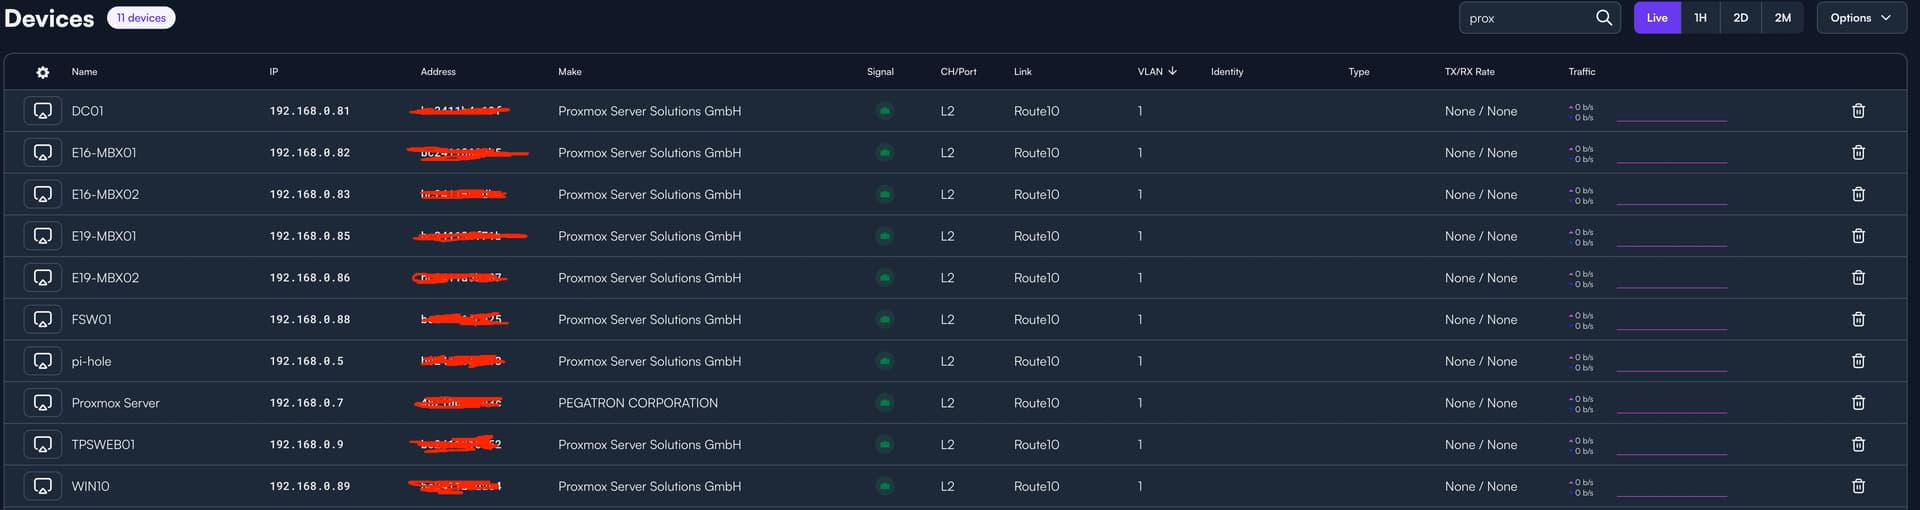
If 100% of the network is Alta, the Ch/Port and Link columns should show accurate topology. Things get a little weird if there’s a 3rd party switch. anything plugged into that switch would show the upstream Ch/Port interface and device.
If the list of flatlined devices are plugged into Alta switches, then yes, something is off in the display. If that’s the case, let me know and I can take a look at it.
I remember I have a small ubiquiti 5 port switch that is connected to one of my proxmox servers hosting a few clients. But I would assume they would appear on the alta switch since that is the one connected between the ubuqitui switch and the router… but thanks for the clarification!
The end devices themselves should appear as long as they pass traffic semi-regularly that traverses an Alta device. If they don’t traverse an Alta device, of course, we can’t get reliable analytics for them.
Would you be able to post screenshots of what you’re seeing?
The Alta devices themselves don’t send much data at all to/from the controller; just statistical data. However, they do send it fairly frequently at 30 second intervals. Even firmware updates are downloaded by the devices themselves, not sourcing from the controller.
If you really wanted to test this, we just posted an iPerf article in our knowledgebase. The APs have iPerf by default, but do note that iPerf traffic is not hardware offloaded and thus shouldn’t be used as a true metric of throughput capability. You’ll see 100-200mbps, which should be plenty to pop a traffic graph provided the other end of the iPerf test is also on the Proxmox server.
I just uploaded an ISO image 4 GB to the proxmox server and still a flat line on the live graph for the wired host itself…
I can see the traffic on the live graph from my mac and the AP6-PRO… (wifi)