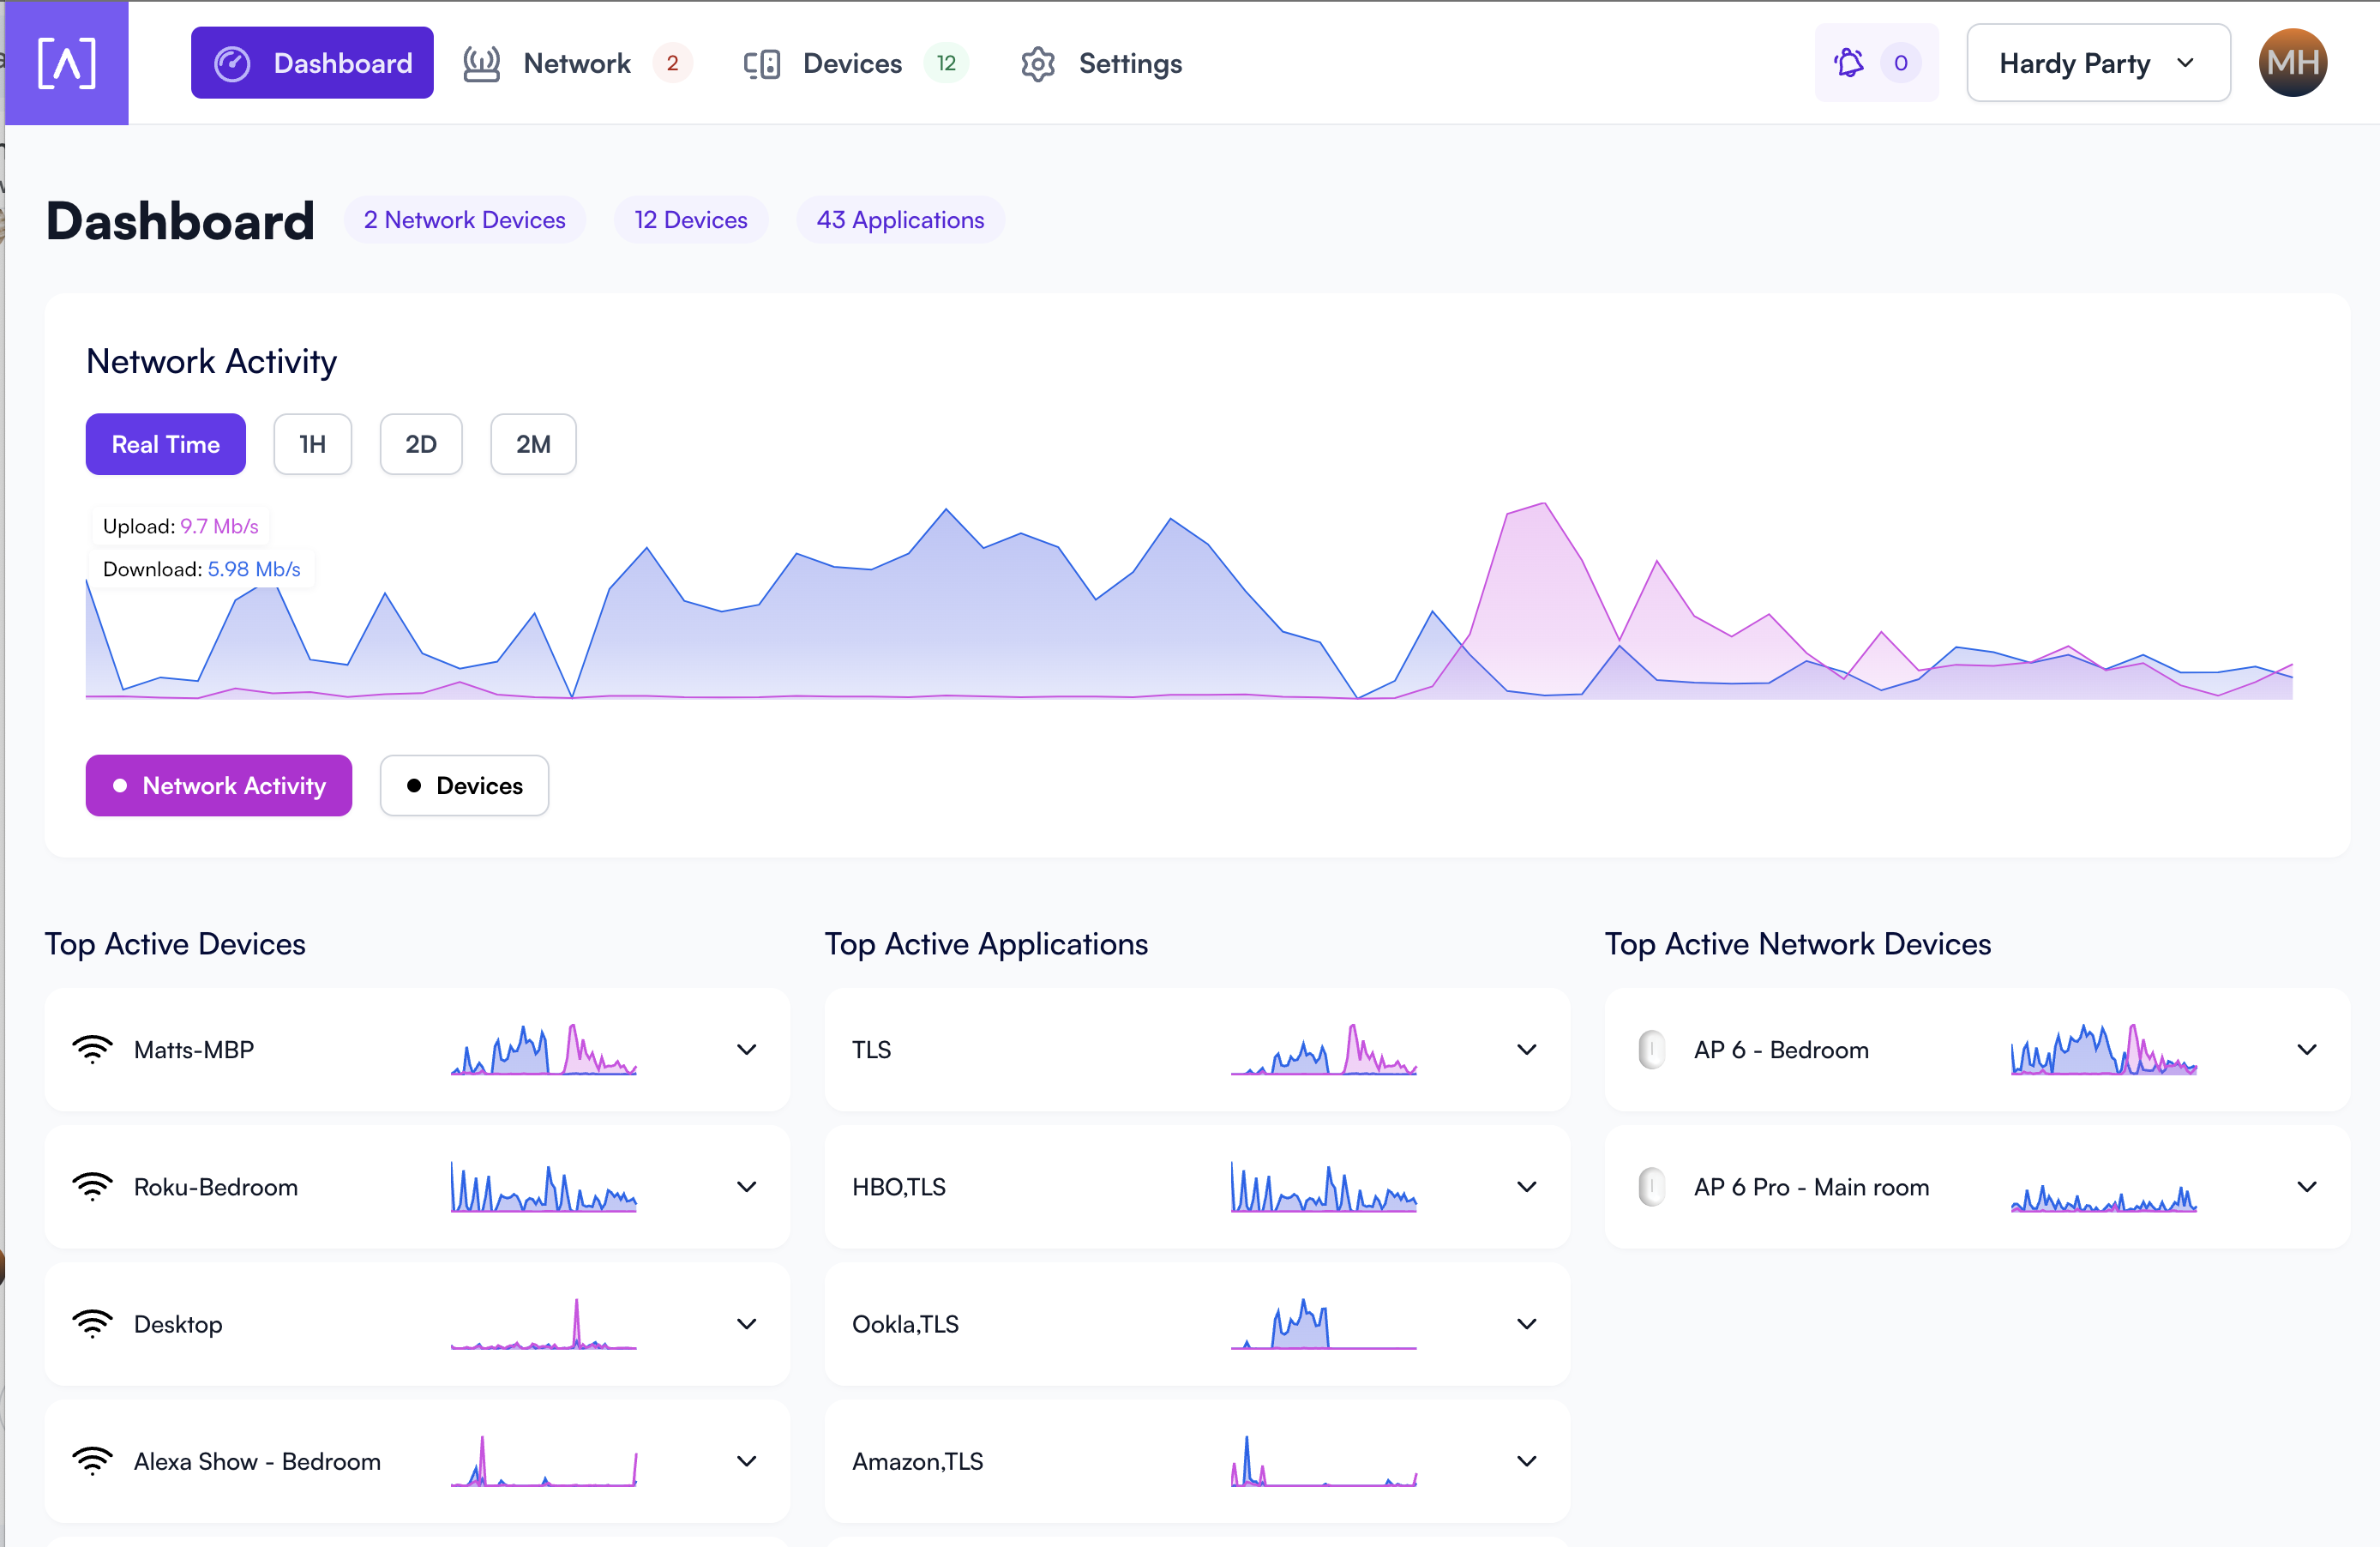
Hi guys! We just pushed the newest dashboard to https://manage.alta.inc today. We’re excited about it so let us know what you think for a per-site dashboard.
Let us know any requests or if you see any issues, etc…
Thanks!
-Matt
Hi guys! We just pushed the newest dashboard to https://manage.alta.inc today. We’re excited about it so let us know what you think for a per-site dashboard.
Let us know any requests or if you see any issues, etc…
Thanks!
-Matt
It’s nice and clean looking; I’d like to see it in action. Do you have a simulator? Or do I just log into manage.alta.inc?
What technology is it built on? What database, what coding language, what preferred and supported OS?
Hey Todd!
We’re using a few different AWS technologies, that should easily scale to millions of devices.
It’s regionally distributed and prepared for fail-over if necessary.
I’ll see if we can get you a way to test the platform ![]()
Woohoo drag and drop of cards is now perfect ![]()
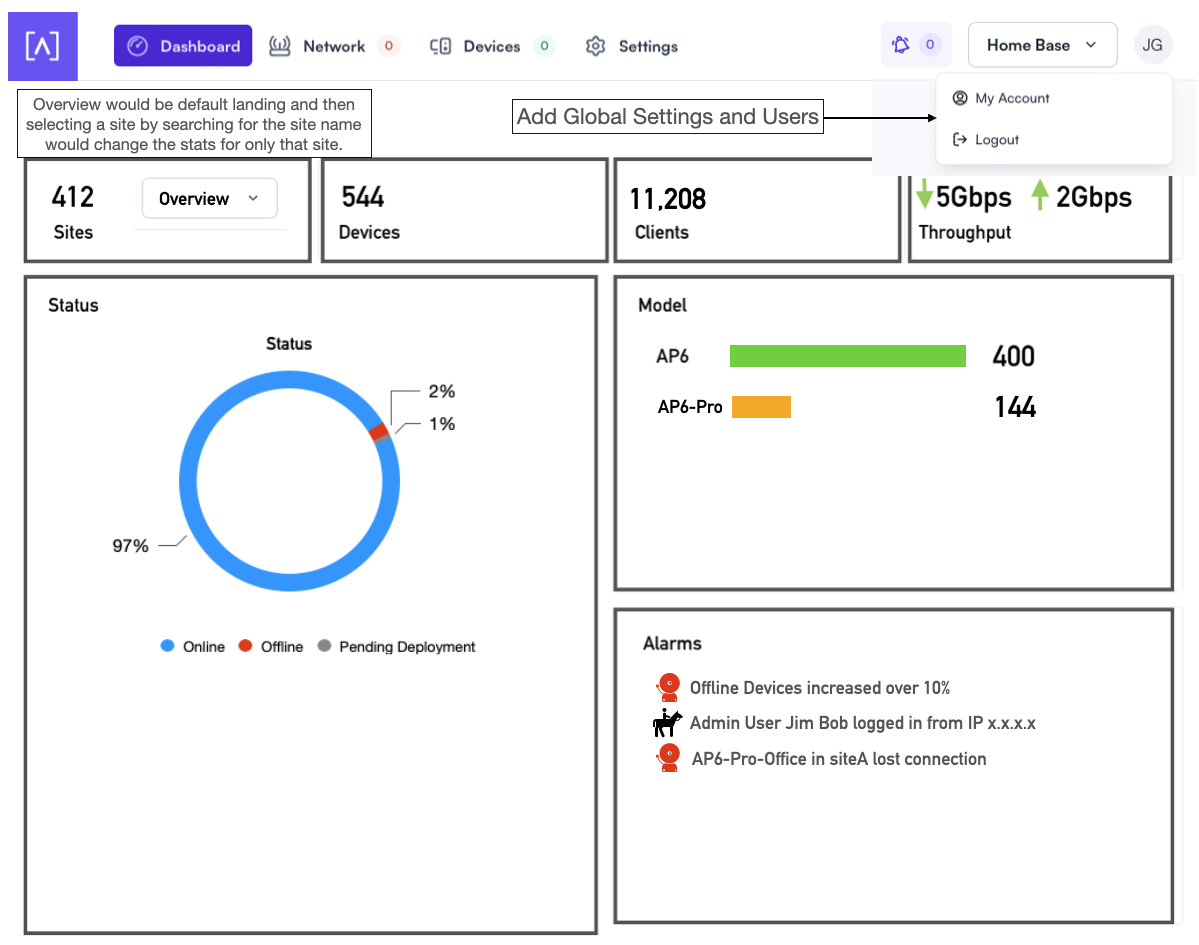
@Alta-MattH Looking good! I like the new Dashboard look per site. Here are a few suggestions thinking with a MSP or ISP deployment type scale mindset.
I’d like the main dashboard when logging in to be “up” a level. For example, If I have thousands of sites (we give a managed AP to all of our FISP/WISP business customers) I want to see how many devices are online for all of my sites without having to go into each site dashboard. See the quick draft below.
I really like the traffic graphs on the site dashboard, bringing this up a level as well to chart the APs online/offline would be good.
Adding pre-set alarms based on a percentage change in devices would be nice. Although most users likely have other network monitoring in place, it doesn’t hurt.
User Permissions - I give our internal staff Admin access without delete device permissions. I would need to invite staff to our portal as a global user to add and manage all sites rather than invite them to each site.
First one to find the easter egg in my little global dashboard draft image wins a prize.
Last suggestion for now, would be nice for some AP’s to magically appear in my portal for testing. ![]()
Really good mockup of a dashboard showing various components:
I’m really hoping for something like this soon as well. I’m managing close to 2 dozen networks now and having to grant access to each one to staff is becoming cumbersome without using a shared account. I’d really rather not have to resort to a shared account as then accountability on who is making changes is impossible.
Have you tried using the Groups feature?
Nope but that’s really close to what I’d be looking for. I didn’t realize groups were a cross-site thing. There isn’t really anything that indicates this when creating groups. Would be nice in that case to be able to specify a default group that gets added to all sites that are associated with the ISP/MSP.