Today I have received my AP6 access point to test it.
I have had some trouble connection my MacBook Air, but that is fixed now. I don’t know what the problem was but if I get these problems more often I will report it here.
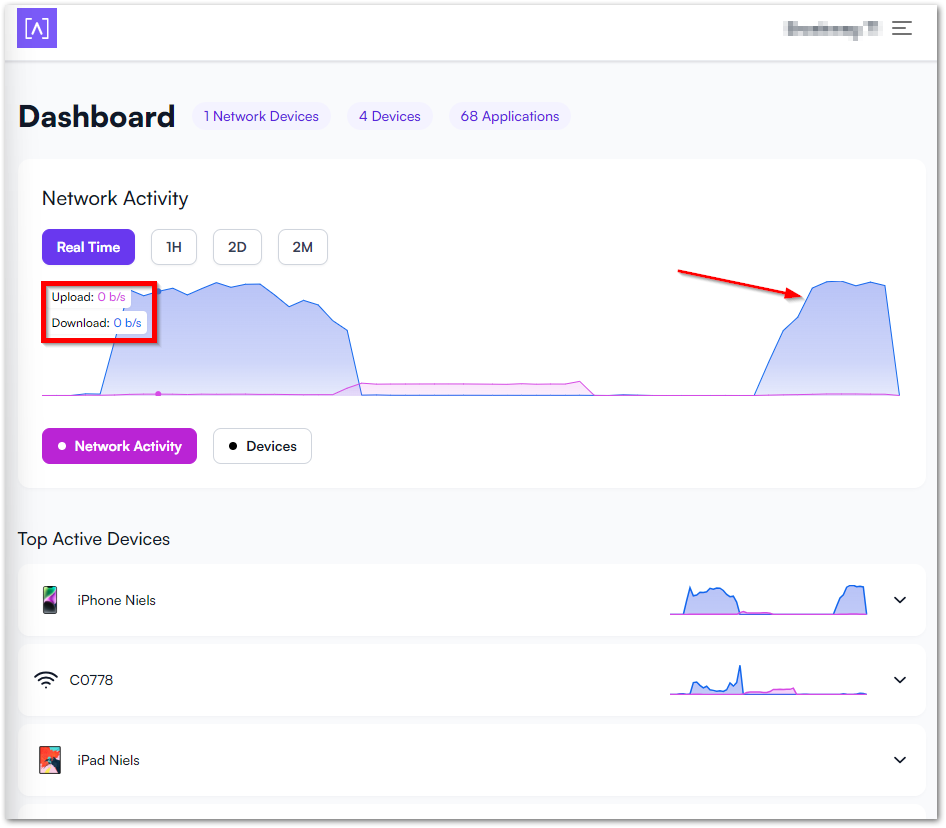
Right now I am connected with two devices on the Alta Labs AP6. My phone is one of them and it’s playing a YouTube video.
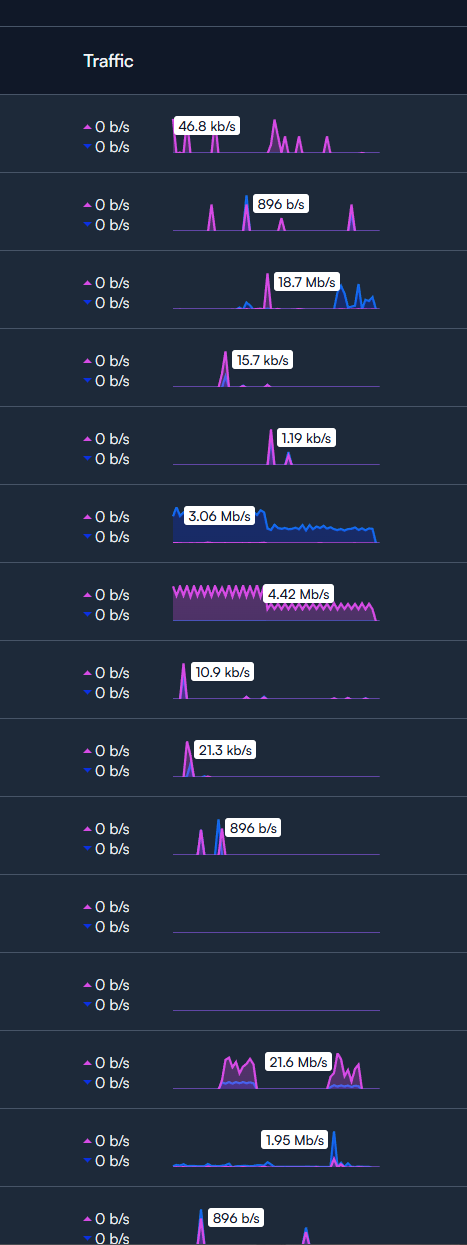
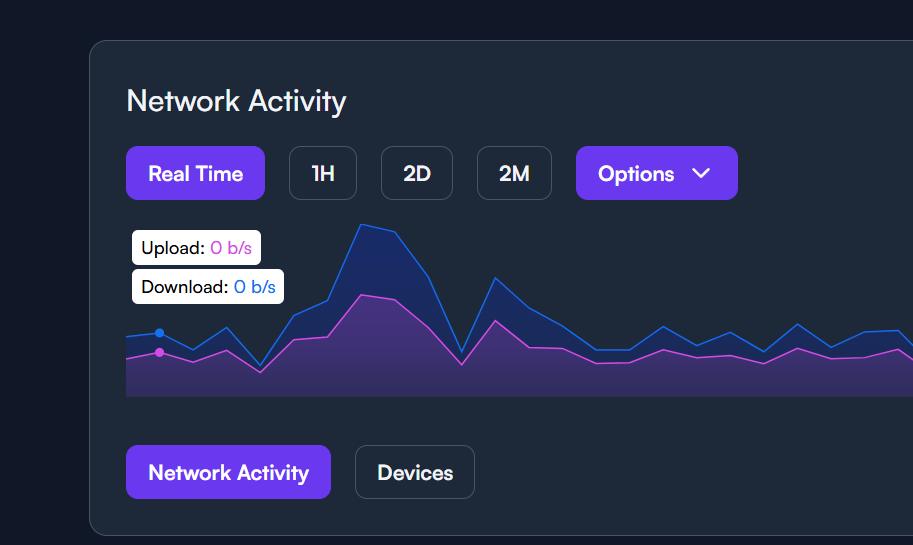
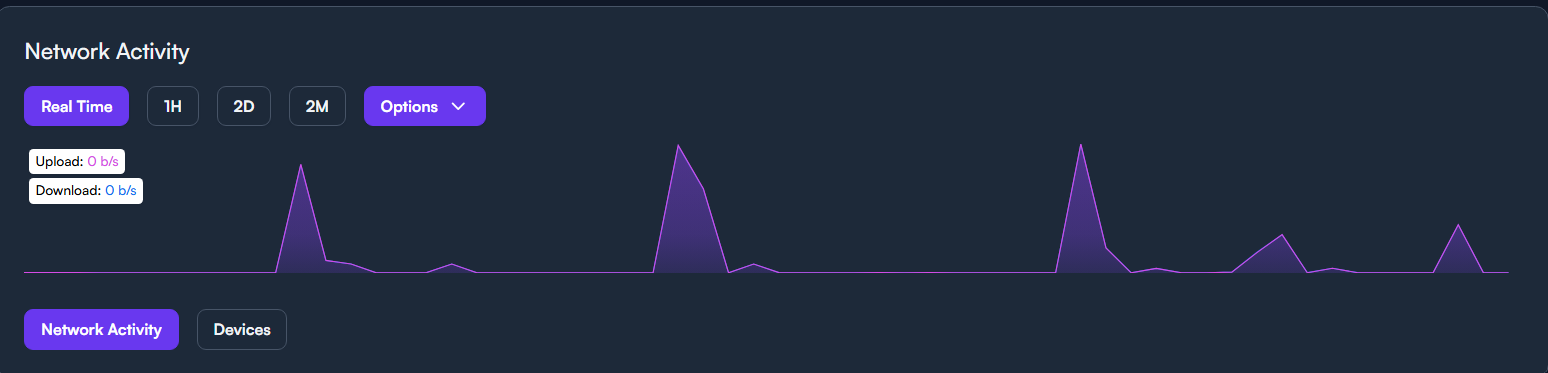
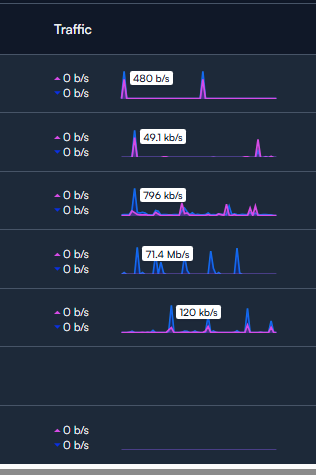
So data is consumed, but it is not displayed in network activity or device activity.
It looks like something is not quite right.
Do you have any advice on how to troubleshoot this problem?
I forgot to mention that the Quick Scan and Full Scan both failed as well.
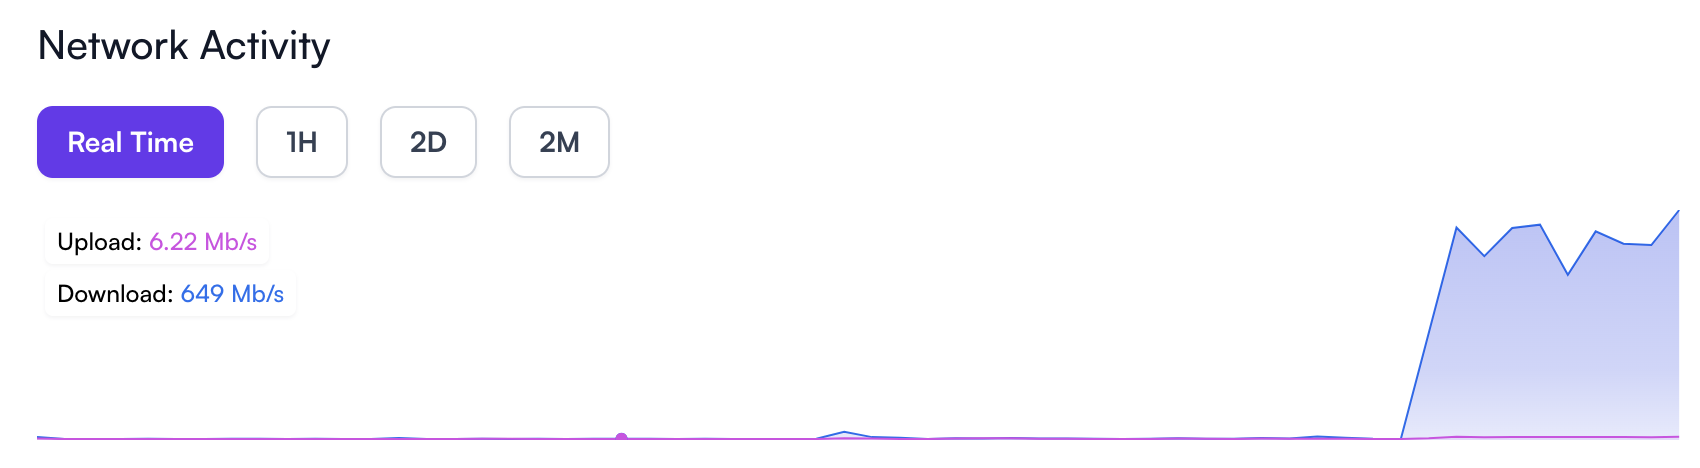
Now I also see the statistics again on the web page. Both scan functions now work as well.
Unfortunately, I cannot explain why this happened, but it now works as it should.
I will test for a few more days, thanks for the quick support!
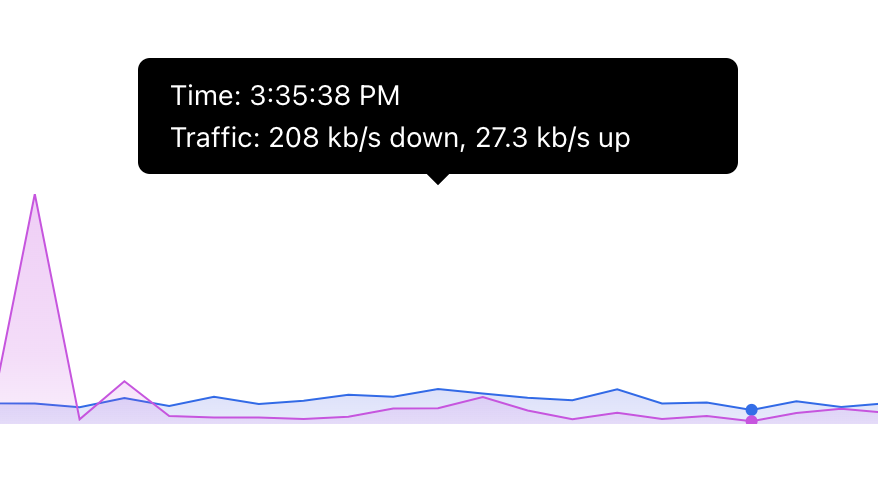
Sorry originally I was thinking you meant this window, when you hover over the timeline. It looks like in the first graph it shows the traffic dropped while it’s saying 0/0.
Has that happened again? It looks like it’s working now…
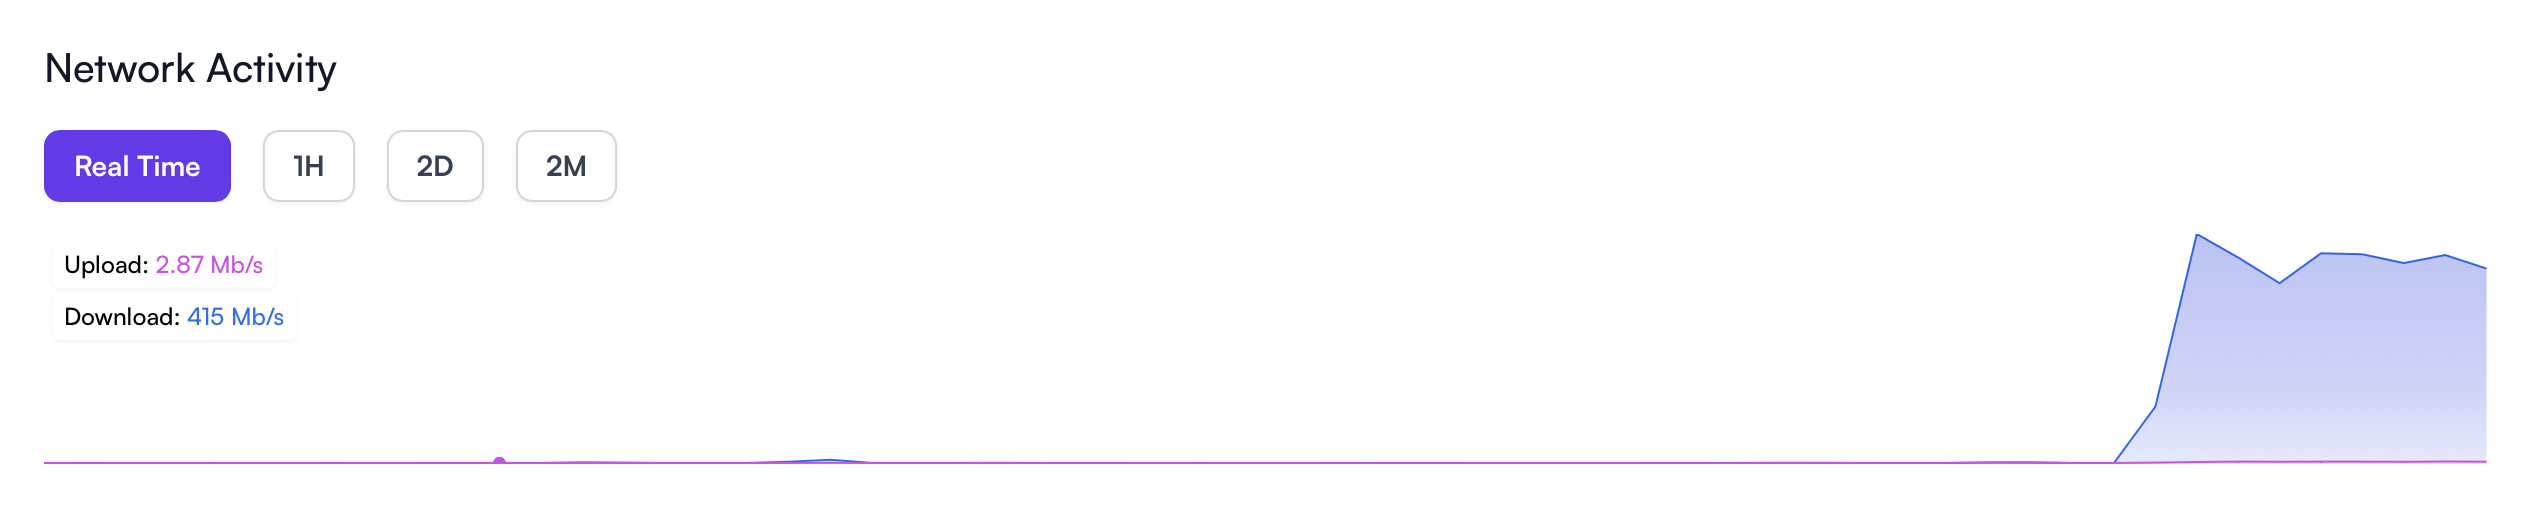
I have this exact problem - wondering how to correct this as i read over this topic and must be missing something??. My overlay shows Upload/Download @ 0 B/s, however i have 80/80mbps of traffic going through. When looking at any overlay for any device, it shows 0 B/s but the live graph is clearly showing the truth.
Hi. Im also having this issue. It seems to only happen on my laptop connecting via the web browser. It works on my mobile device via the app and safari web browser. Ive tried Chrome, Opera, Edge & Firefox all to no avail.