I am mostly a fan of the Route10 and I understand its a work in progress and some if not all of these things might in the development pipeline but coming from Unifi its really hard to know what my Route 10 is doing.
What WAN connection is currently active
Which WAN connections are available to use
What is the IPs of each WAN connection
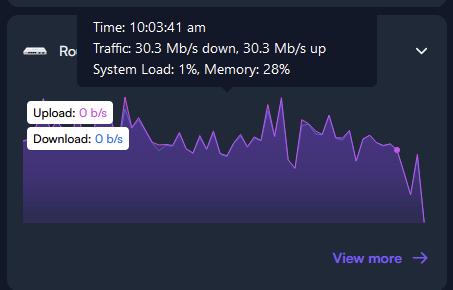
Current traffic, I can be uploading at 30Mbps from my connection but the Route10 will show 30Mbps in both directions
History of WAN health
I don’t expect Alta to match Unifi feature for feature including design but anything close to the PFSense dashboard would be awesome. Just blocks of information that are live would be awesome.
You can see the IPv4 and IPv6 addresses of your WAN connections by hovering over the IP address in the Network page. You can see the traffic for the WAN port itself by clicking on the device icon to the left of the name (on the Network page), then expand the Traffic dropdown.
I could be wrong but I think this is being shown as intended. I just did one of those online speed tests and took a screenshot whilst it was uploading.
Any specific reason why its hidden under a tooltip? Theres so much screen real estate thats not being used, it just seems like a strange design choice to hide things like WAN IP, and DDNS address under it. Also I cant seem to find this at all under the mobile app.
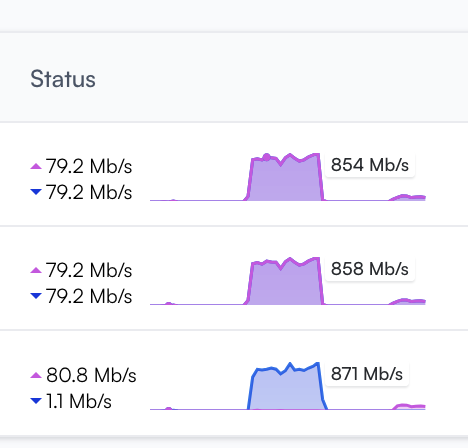
I agree the dashboard needs to be customizable. Like today I was playing around and I can’t see any of the uplinks utilization separately unless I look at this tiny tooltip. It’s frustrating as there is so much space you could add these as well. I also couldn’t find any place to see how much total data has been transferred out my wan(see if anything is running wild).